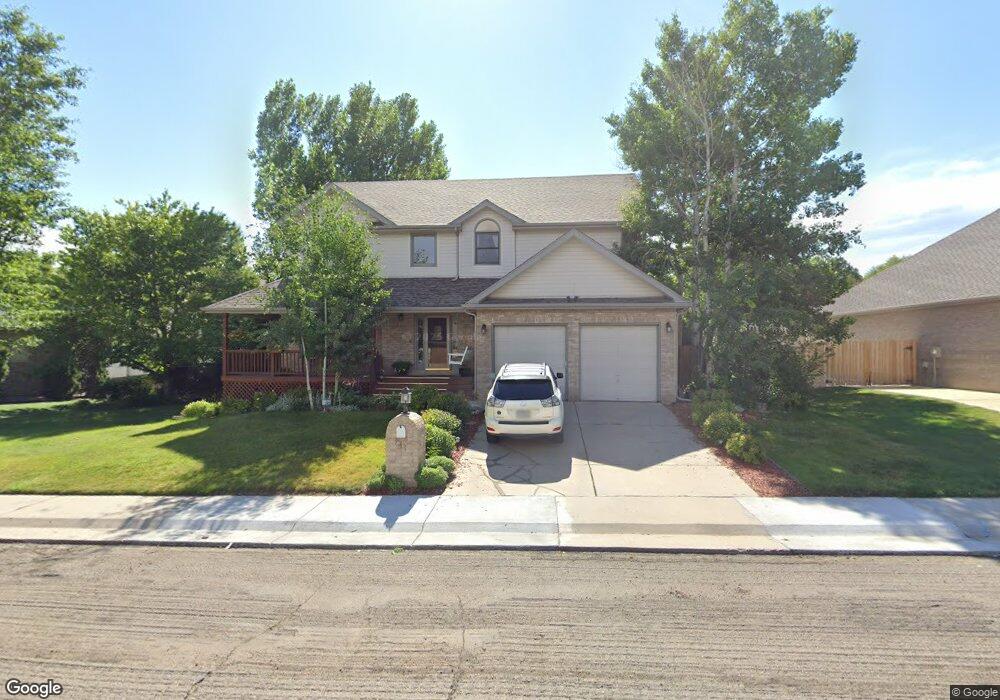
941 Wright Ct Golden, CO 80401
Ashwood NeighborhoodEstimated Value: $916,383 - $1,082,000
5
Beds
7
Baths
2,497
Sq Ft
$401/Sq Ft
Est. Value
About This Home
This home is located at 941 Wright Ct, Golden, CO 80401 and is currently estimated at $1,002,346, approximately $401 per square foot. 941 Wright Ct is a home located in Jefferson County with nearby schools including Welchester Elementary School, Bell Middle School, and Golden High School.
Ownership History
Date
Name
Owned For
Owner Type
Purchase Details
Closed on
Aug 20, 1999
Sold by
Stark Michael
Bought by
Stark Michael and Stark Stefanie A
Current Estimated Value
Home Financials for this Owner
Home Financials are based on the most recent Mortgage that was taken out on this home.
Original Mortgage
$235,000
Outstanding Balance
$67,531
Interest Rate
7.65%
Estimated Equity
$934,815
Purchase Details
Closed on
Feb 17, 1999
Sold by
Meadow Ridge Estates Llc
Bought by
C Nelson Homes Inc
Create a Home Valuation Report for This Property
The Home Valuation Report is an in-depth analysis detailing your home's value as well as a comparison with similar homes in the area
Home Values in the Area
Average Home Value in this Area
Purchase History
| Date | Buyer | Sale Price | Title Company |
|---|---|---|---|
| Stark Michael | -- | Land Title | |
| Stark Michael | $309,748 | Land Title | |
| C Nelson Homes Inc | $72,900 | Land Title |
Source: Public Records
Mortgage History
| Date | Status | Borrower | Loan Amount |
|---|---|---|---|
| Open | Stark Michael | $235,000 |
Source: Public Records
Tax History
| Year | Tax Paid | Tax Assessment Tax Assessment Total Assessment is a certain percentage of the fair market value that is determined by local assessors to be the total taxable value of land and additions on the property. | Land | Improvement |
|---|---|---|---|---|
| 2024 | $5,096 | $57,466 | $15,674 | $41,792 |
| 2023 | $5,096 | $57,466 | $15,674 | $41,792 |
| 2022 | $4,211 | $46,525 | $17,293 | $29,232 |
| 2021 | $4,258 | $47,865 | $17,791 | $30,074 |
| 2020 | $3,910 | $44,046 | $17,109 | $26,937 |
| 2019 | $3,853 | $44,046 | $17,109 | $26,937 |
| 2018 | $3,877 | $42,710 | $11,796 | $30,914 |
| 2017 | $3,505 | $42,710 | $11,796 | $30,914 |
| 2016 | $3,755 | $42,691 | $10,278 | $32,413 |
| 2015 | $3,071 | $42,691 | $10,278 | $32,413 |
| 2014 | $3,071 | $32,708 | $8,406 | $24,302 |
Source: Public Records
Map
Nearby Homes
- 952 Xenon Ct
- 12421 W 9th Place
- 1000 Xenon St
- 840 Welch St
- 771 Xenon St
- 880 Vivian St
- 750 Xenon St
- 12576 W 7th Ave
- 1260 Welch St
- 764 Vivian St
- 1065 Zang St
- 835 Urban St
- 1070 Urban St
- 12617 W 6th Place
- 811 Union St
- 1240 Urban St
- 13320 W 10th Ave
- 11980 W Pleasant Ave
- 985 Tabor St
- 579 Wright St Unit 207
Your Personal Tour Guide
Ask me questions while you tour the home.