Estimated Value: $653,367 - $830,000
4
Beds
3
Baths
2,752
Sq Ft
$273/Sq Ft
Est. Value
About This Home
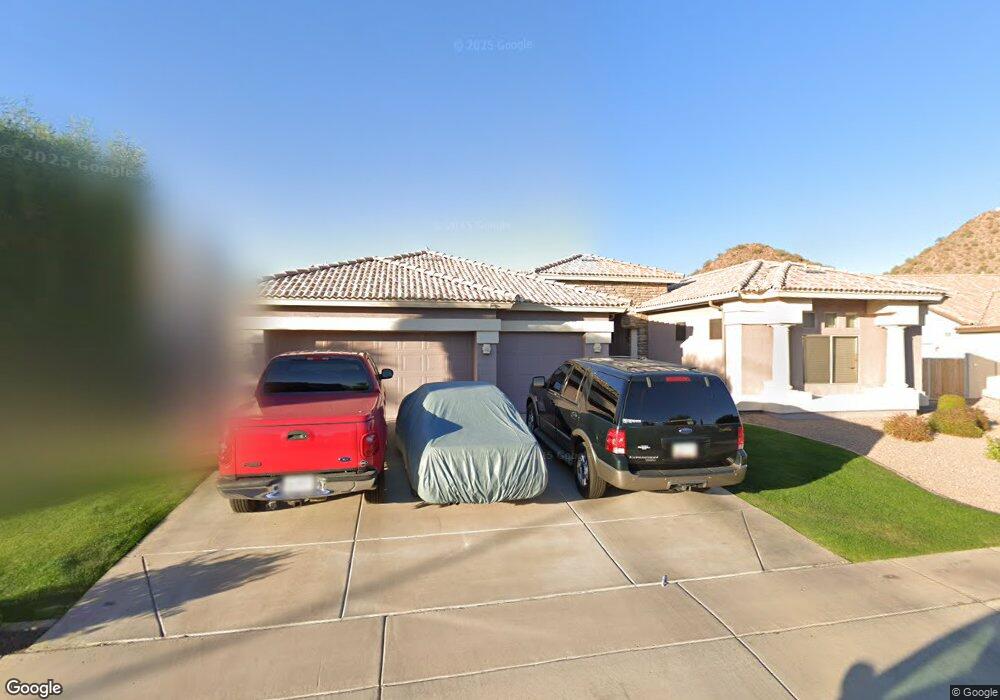
This home is located at 9410 E Hobart St, Mesa, AZ 85207 and is currently estimated at $751,342, approximately $273 per square foot. 9410 E Hobart St is a home located in Maricopa County with nearby schools including Franklin at Brimhall Elementary School, Zaharis Elementary School, and Franklin West Elementary School.
Ownership History
Date
Name
Owned For
Owner Type
Purchase Details
Closed on
May 10, 2018
Sold by
Stich Shanna
Bought by
Stich Mark and Stich Shanna
Current Estimated Value
Purchase Details
Closed on
Apr 20, 2017
Sold by
Myers Paula Neely
Bought by
Neely Myers Paula Neely
Purchase Details
Closed on
Nov 20, 2002
Sold by
Thibadeau Michael and Thibadeau Virginia
Bought by
The Neely Family Ltd Partnership #2
Purchase Details
Closed on
Dec 4, 2000
Sold by
Richmond American Homes Of Arizona Inc
Bought by
Thibadeau Michael and Thibadeau Virginia
Home Financials for this Owner
Home Financials are based on the most recent Mortgage that was taken out on this home.
Original Mortgage
$160,000
Interest Rate
7.66%
Mortgage Type
New Conventional
Create a Home Valuation Report for This Property
The Home Valuation Report is an in-depth analysis detailing your home's value as well as a comparison with similar homes in the area
Purchase History
| Date | Buyer | Sale Price | Title Company |
|---|---|---|---|
| Stich Mark | -- | None Available | |
| Neely Myers Paula Neely | -- | None Available | |
| Estate Of Revy Leora Neely | -- | None Available | |
| The Neely Family Ltd Partnership #2 | $305,000 | North American Title Co | |
| Thibadeau Michael | $276,939 | Fidelity National Title |
Source: Public Records
Mortgage History
| Date | Status | Borrower | Loan Amount |
|---|---|---|---|
| Previous Owner | Thibadeau Michael | $160,000 |
Source: Public Records
Tax History
| Year | Tax Paid | Tax Assessment Tax Assessment Total Assessment is a certain percentage of the fair market value that is determined by local assessors to be the total taxable value of land and additions on the property. | Land | Improvement |
|---|---|---|---|---|
| 2025 | $3,300 | $39,528 | -- | -- |
| 2024 | $3,318 | $37,646 | -- | -- |
| 2023 | $3,318 | $56,600 | $11,320 | $45,280 |
| 2022 | $3,246 | $42,110 | $8,420 | $33,690 |
| 2021 | $3,335 | $38,700 | $7,740 | $30,960 |
| 2020 | $3,290 | $36,860 | $7,370 | $29,490 |
| 2019 | $3,048 | $35,500 | $7,100 | $28,400 |
| 2018 | $2,910 | $33,020 | $6,600 | $26,420 |
| 2017 | $2,819 | $32,950 | $6,590 | $26,360 |
| 2016 | $2,768 | $33,980 | $6,790 | $27,190 |
| 2015 | $2,613 | $32,130 | $6,420 | $25,710 |
Source: Public Records
Map
Nearby Homes
- 9435 E Hobart Cir
- 9310 E Mclellan Rd
- 1423 N Vincent Cir
- 1356 N Bernard
- 9629 E Grandview St
- 9123 E Gary Ln
- 9515 E Julep Cir
- 9663 E Inglewood Cir
- 9661 E Glencove Cir
- 9711 E Glencove Cir
- 9718 E Inglewood Cir
- 9661 E Greenway St
- 8965 E Hillview St
- 1816 N Bernard
- 9004 E Grandview Dr
- 9762 E Inglewood Cir
- 8942 E Hobart St
- 9009 E Gary Ln
- 9747 E Greenway St
- 1865 N Bernard Cir
- 9402 E Hobart St
- 9418 E Hobart St
- 00000 E Hobart St
- 9360 E Hobart St
- 9411 E Hobart St
- 9403 E Hobart St
- 1465 N Duval
- 9361 E Hobart St
- 1457 N Duval
- 9352 E Hobart St
- 9401 E Mclellan Rd
- 9353 E Hobart St
- 9412 E Hillview Cir
- 1449 N Duval
- 9404 E Hillview Cir
- 9411 E Mclellan Rd
- 9344 E Hobart St
- 9362 E Hillview Cir
- 9345 E Hobart St
- 1441 N Duval
Your Personal Tour Guide
Ask me questions while you tour the home.