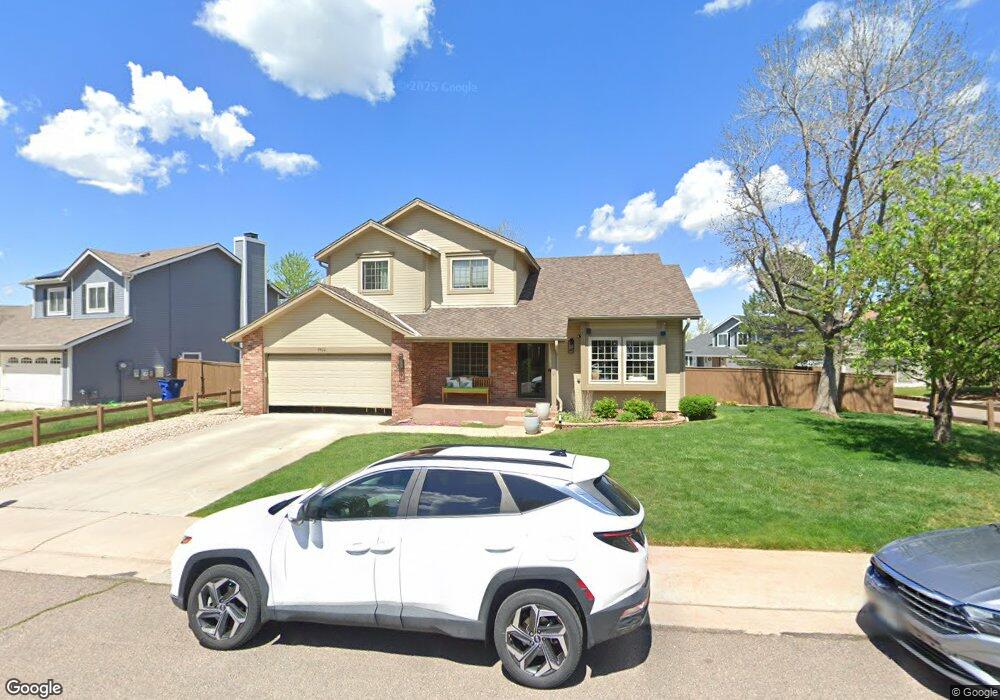
9412 Crestmore Way Highlands Ranch, CO 80126
Northridge NeighborhoodEstimated Value: $690,000 - $709,000
3
Beds
3
Baths
2,191
Sq Ft
$319/Sq Ft
Est. Value
About This Home
This home is located at 9412 Crestmore Way, Highlands Ranch, CO 80126 and is currently estimated at $699,724, approximately $319 per square foot. 9412 Crestmore Way is a home located in Douglas County with nearby schools including Northridge Elementary School, Mountain Ridge Middle School, and Mountain Vista High School.
Ownership History
Date
Name
Owned For
Owner Type
Purchase Details
Closed on
Nov 26, 1997
Sold by
Foster Samuel C
Bought by
Kancir Rick L and Kancir Susan C
Current Estimated Value
Home Financials for this Owner
Home Financials are based on the most recent Mortgage that was taken out on this home.
Original Mortgage
$118,500
Interest Rate
7.31%
Purchase Details
Closed on
Nov 25, 1997
Sold by
Kancir Andrew J
Bought by
Kancir Rick L and Kancir Susan C
Home Financials for this Owner
Home Financials are based on the most recent Mortgage that was taken out on this home.
Original Mortgage
$118,500
Interest Rate
7.31%
Purchase Details
Closed on
Jun 30, 1992
Sold by
Motsinger James F and Motskinger Tracy L
Bought by
Kancir Rick L and Kancir Susan C
Purchase Details
Closed on
Mar 11, 1986
Sold by
Mission Viejo Co
Bought by
Motsinger James F and Motsinger Tracy L
Create a Home Valuation Report for This Property
The Home Valuation Report is an in-depth analysis detailing your home's value as well as a comparison with similar homes in the area
Home Values in the Area
Average Home Value in this Area
Purchase History
| Date | Buyer | Sale Price | Title Company |
|---|---|---|---|
| Kancir Rick L | -- | First American Heritage Titl | |
| Kancir Rick L | -- | First American Heritage Titl | |
| Kancir Rick L | $150,500 | -- | |
| Motsinger James F | $138,100 | -- |
Source: Public Records
Mortgage History
| Date | Status | Borrower | Loan Amount |
|---|---|---|---|
| Closed | Kancir Rick L | $118,500 |
Source: Public Records
Tax History Compared to Growth
Tax History
| Year | Tax Paid | Tax Assessment Tax Assessment Total Assessment is a certain percentage of the fair market value that is determined by local assessors to be the total taxable value of land and additions on the property. | Land | Improvement |
|---|---|---|---|---|
| 2024 | $3,664 | $49,270 | $10,840 | $38,430 |
| 2023 | $3,658 | $49,270 | $10,840 | $38,430 |
| 2022 | $3,266 | $35,750 | $7,340 | $28,410 |
| 2021 | $3,397 | $35,750 | $7,340 | $28,410 |
| 2020 | $3,138 | $33,830 | $6,980 | $26,850 |
| 2019 | $3,149 | $33,830 | $6,980 | $26,850 |
| 2018 | $2,827 | $29,910 | $6,380 | $23,530 |
| 2017 | $2,574 | $29,910 | $6,380 | $23,530 |
| 2016 | $2,461 | $28,070 | $6,540 | $21,530 |
| 2015 | $2,514 | $28,070 | $6,540 | $21,530 |
| 2014 | $2,134 | $22,000 | $4,340 | $17,660 |
Source: Public Records
Map
Nearby Homes
- 9361 Crestmore Way
- 1146 Cherry Blossom Ct
- 867 Summer Dr Unit 9C
- 842 Summer Dr Unit 3E
- 996 Cherry Blossom Ct
- 966 Cherry Blossom Ct
- 745 Stowe St
- 669 Walden Ct
- 9151 Weatherstone Ct
- 8982 Sunset Ridge Ct
- 9191 Hickory Cir
- 9492 Joyce Ln
- 9510 Joyce Ln
- 2105 Weatherstone Cir
- 9603 Chesapeake St
- 9170 Stargrass Cir
- 2226 Thistle Ridge Cir
- 9409 Prairie View Dr
- 2249 Weatherstone Cir
- 768 Poppywood Place
- 9343 Montrose Way
- 9432 Crestmore Way
- 9354 Montrose Way
- 9372 Crestmore Way
- 9411 S Crestmore Way
- 9344 Montrose Way
- 9411 Crestmore Way
- 9421 S Crestmore Way
- 9333 Montrose Way
- 9401 Crestmore Way
- 9421 Crestmore Way
- 9391 S Crestmore Way
- 9452 Crestmore Way
- 9362 Crestmore Way
- 9334 Montrose Way
- 9391 Crestmore Way
- 9431 Crestmore Way
- 9323 Montrose Way
- 9325 Windsor Way
- 9324 Montrose Way