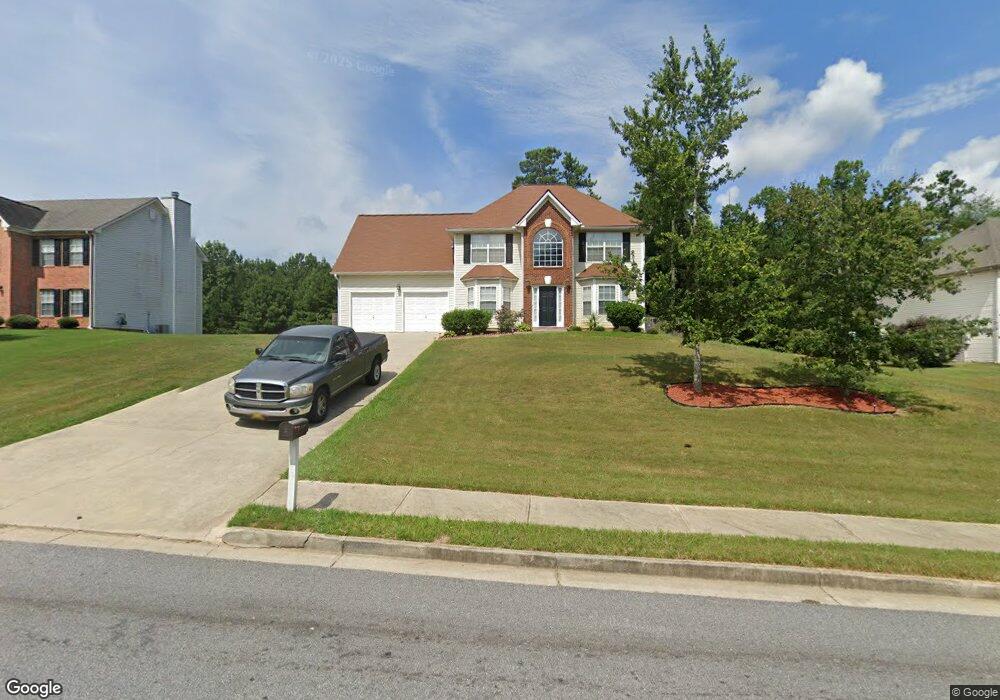
9413 Carnes Crossing Cir Jonesboro, GA 30236
Estimated Value: $327,284 - $411,000
4
Beds
3
Baths
2,740
Sq Ft
$135/Sq Ft
Est. Value
About This Home
This home is located at 9413 Carnes Crossing Cir, Jonesboro, GA 30236 and is currently estimated at $368,571, approximately $134 per square foot. 9413 Carnes Crossing Cir is a home located in Clayton County with nearby schools including Suder Elementary School, M. D. Roberts Middle School, and Jonesboro High School.
Ownership History
Date
Name
Owned For
Owner Type
Purchase Details
Closed on
Jan 3, 2018
Sold by
Mondesir Darly
Bought by
Browdy Floretta
Current Estimated Value
Home Financials for this Owner
Home Financials are based on the most recent Mortgage that was taken out on this home.
Original Mortgage
$184,496
Outstanding Balance
$156,441
Interest Rate
4.4%
Mortgage Type
FHA
Estimated Equity
$212,130
Purchase Details
Closed on
May 1, 2012
Sold by
Household Realty Corp
Bought by
Mondesir Darly
Home Financials for this Owner
Home Financials are based on the most recent Mortgage that was taken out on this home.
Original Mortgage
$69,692
Interest Rate
4.01%
Mortgage Type
New Conventional
Purchase Details
Closed on
Jan 4, 2011
Sold by
Mam Vuthy
Bought by
Household Rlty
Purchase Details
Closed on
Jan 16, 2003
Sold by
Scenic Homes Inc
Bought by
Mam Vuthy
Home Financials for this Owner
Home Financials are based on the most recent Mortgage that was taken out on this home.
Original Mortgage
$150,300
Interest Rate
5.95%
Mortgage Type
New Conventional
Create a Home Valuation Report for This Property
The Home Valuation Report is an in-depth analysis detailing your home's value as well as a comparison with similar homes in the area
Home Values in the Area
Average Home Value in this Area
Purchase History
| Date | Buyer | Sale Price | Title Company |
|---|---|---|---|
| Browdy Floretta | $187,900 | -- | |
| Mondesir Darly | $87,115 | -- | |
| Household Rlty | $77,571 | -- | |
| Mam Vuthy | $150,900 | -- |
Source: Public Records
Mortgage History
| Date | Status | Borrower | Loan Amount |
|---|---|---|---|
| Open | Browdy Floretta | $184,496 | |
| Previous Owner | Mondesir Darly | $69,692 | |
| Previous Owner | Mam Vuthy | $150,300 |
Source: Public Records
Tax History Compared to Growth
Tax History
| Year | Tax Paid | Tax Assessment Tax Assessment Total Assessment is a certain percentage of the fair market value that is determined by local assessors to be the total taxable value of land and additions on the property. | Land | Improvement |
|---|---|---|---|---|
| 2024 | $4,858 | $133,560 | $10,400 | $123,160 |
| 2023 | $4,873 | $134,960 | $10,400 | $124,560 |
| 2022 | $3,054 | $86,840 | $10,400 | $76,440 |
| 2021 | $2,904 | $82,560 | $10,400 | $72,160 |
| 2020 | $2,835 | $79,927 | $10,400 | $69,527 |
| 2019 | $2,683 | $75,160 | $10,400 | $64,760 |
| 2018 | $2,739 | $66,533 | $10,400 | $56,133 |
| 2017 | $2,197 | $53,057 | $10,400 | $42,657 |
| 2016 | $1,899 | $45,725 | $10,400 | $35,325 |
| 2015 | $1,640 | $0 | $0 | $0 |
| 2014 | $1,544 | $37,871 | $10,400 | $27,471 |
Source: Public Records
Map
Nearby Homes
- 2744 Lisa Dr
- 2769 Stancil Blvd
- 2461 Creekside Trace
- 2811 Carnes Rd
- 9344 Hidden Hollow Trail
- 2544 Carnes Rd
- 2519 Quentin Dr
- 9361 Sweetbriar Cir
- 2508 Quentin Dr
- 2283 Noahs Ark Rd
- 0 Carnes Rd Unit 7665396
- 2444 Quentin Dr
- 2328 Carnes Rd
- 3027 Jodeco Dr
- 2330 Lago Dr
- 2345 Lake Jodeco Rd
- 9342 Carillon Ct
- 9163 Retreat Pass
- 2105 Fair Ridge Ct
- 9361 Arbor Glen Ct Unit 13
- 9405 Carnes Crossing Cir
- 9421 Carnes Crossing Cir
- 9397 Carnes Crossing Cir
- 9429 Carnes Crossing Cir
- 9245 Carnes Crossing Cir
- 9237 Carnes Crossing Cir
- 9253 Carnes Crossing Cir
- 9418 Carnes Crossing Cir
- 9410 Carnes Crossing Cir Unit II
- 9261 Carnes Crossing Cir
- 9229 Carnes Crossing Cir
- 9389 Carnes Crossing Cir
- 9437 Carnes Crossing Cir
- 9426 Carnes Crossing Cir
- 9402 Carnes Crossing Cir
- 9434 Canes Crossing Cir
- 9392 Carnes Crossing Cir
- 9269 Carnes Crossing Cir
- 9221 Carnes Crossing Cir
- 9434 Carnes Crossing Cir