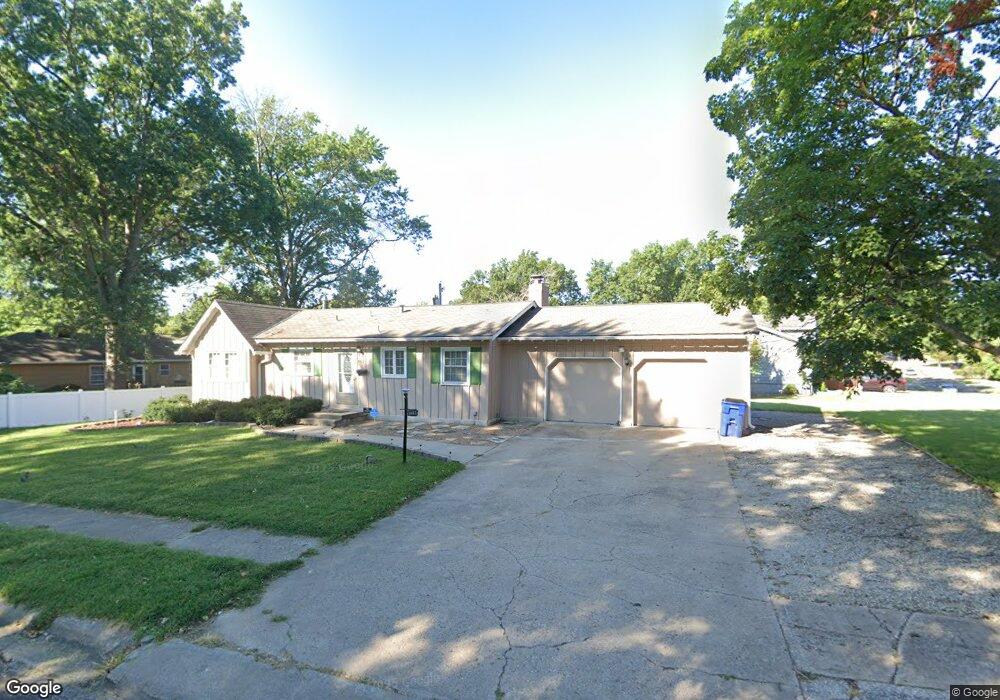
9413 E 80th Terrace Raytown, MO 64138
Estimated Value: $219,000 - $263,000
3
Beds
2
Baths
1,162
Sq Ft
$206/Sq Ft
Est. Value
About This Home
This home is located at 9413 E 80th Terrace, Raytown, MO 64138 and is currently estimated at $239,442, approximately $206 per square foot. 9413 E 80th Terrace is a home located in Jackson County with nearby schools including Southwood Elementary, South Middle School, and Carver Christian Academy.
Ownership History
Date
Name
Owned For
Owner Type
Purchase Details
Closed on
Dec 22, 2021
Sold by
Richards Tia C and Richards Therron W
Bought by
Richardson Tia C and Richardson Therron
Current Estimated Value
Home Financials for this Owner
Home Financials are based on the most recent Mortgage that was taken out on this home.
Original Mortgage
$152,000
Outstanding Balance
$118,942
Interest Rate
2.39%
Mortgage Type
New Conventional
Estimated Equity
$120,500
Purchase Details
Closed on
Aug 25, 2009
Sold by
Johnson Howard W and Johnson Lorrie L
Bought by
Craddock Tia
Purchase Details
Closed on
Jan 28, 2002
Sold by
Johnson Howard Earl and Johnson Margaret L
Bought by
Johnson Howard W and Johnson Lorrie L
Home Financials for this Owner
Home Financials are based on the most recent Mortgage that was taken out on this home.
Original Mortgage
$85,000
Interest Rate
7.15%
Mortgage Type
Purchase Money Mortgage
Create a Home Valuation Report for This Property
The Home Valuation Report is an in-depth analysis detailing your home's value as well as a comparison with similar homes in the area
Home Values in the Area
Average Home Value in this Area
Purchase History
| Date | Buyer | Sale Price | Title Company |
|---|---|---|---|
| Richardson Tia C | -- | Security Title Company | |
| Craddock Tia | -- | Missouri Secured Title | |
| Johnson Howard W | -- | Assured Quality Title Co |
Source: Public Records
Mortgage History
| Date | Status | Borrower | Loan Amount |
|---|---|---|---|
| Open | Richardson Tia C | $152,000 | |
| Previous Owner | Johnson Howard W | $85,000 |
Source: Public Records
Tax History
| Year | Tax Paid | Tax Assessment Tax Assessment Total Assessment is a certain percentage of the fair market value that is determined by local assessors to be the total taxable value of land and additions on the property. | Land | Improvement |
|---|---|---|---|---|
| 2025 | $2,451 | $26,634 | $5,299 | $21,335 |
| 2024 | $2,434 | $27,168 | $6,202 | $20,966 |
| 2023 | $2,434 | $27,168 | $5,687 | $21,481 |
| 2022 | $1,894 | $20,140 | $3,278 | $16,862 |
| 2021 | $1,901 | $20,140 | $3,278 | $16,862 |
| 2020 | $1,918 | $20,124 | $3,278 | $16,846 |
| 2019 | $1,908 | $20,124 | $3,278 | $16,846 |
| 2018 | $1,729 | $18,888 | $4,051 | $14,837 |
| 2017 | $1,729 | $18,888 | $4,051 | $14,837 |
| 2016 | $1,676 | $18,416 | $3,523 | $14,893 |
Source: Public Records
Map
Nearby Homes
- 9306 E 81st St
- 8012 Elm Ave
- 7901 Maple Ave
- 9509 E 79th St
- 9301 E 79th St
- 9700 E 82nd Terrace
- 9807 E 79th Terrace
- 9201 E 79th St
- 9601 E 83rd St
- 8117 Manning Ave
- 7725 Arlington Ave
- 9812 E 77th Terrace
- 9005 E 84th St
- 10308 E 81st St
- 8816 E 81st St
- 8516 Ditzler Ave
- 8816 E 84th St
- 8413 Kentucky Ave
- 8705 E 83rd Terrace
- 8220 Willow Way
- 9411 E 80th Terrace
- 9414 E 81st St
- 9412 E 81st St
- 9409 E 80th Terrace
- 9503 E 80th Terrace
- 9410 E 81st St
- 8006 Arlington Ave
- 9412 E 80th Terrace
- 8019 Arlington Ave
- 9406 E 81st St
- 9407 E 80th Terrace
- 9410 E 80th Terrace
- 9507 E 80th Terrace
- 9500 E 80th Terrace
- 9411 E 81st St
- 8021 Arlington Ave
- 9415 E 81st St
- 9409 E 81st St
- 9403 E 80th Terrace
- 9406 E 80th Terrace
Your Personal Tour Guide
Ask me questions while you tour the home.