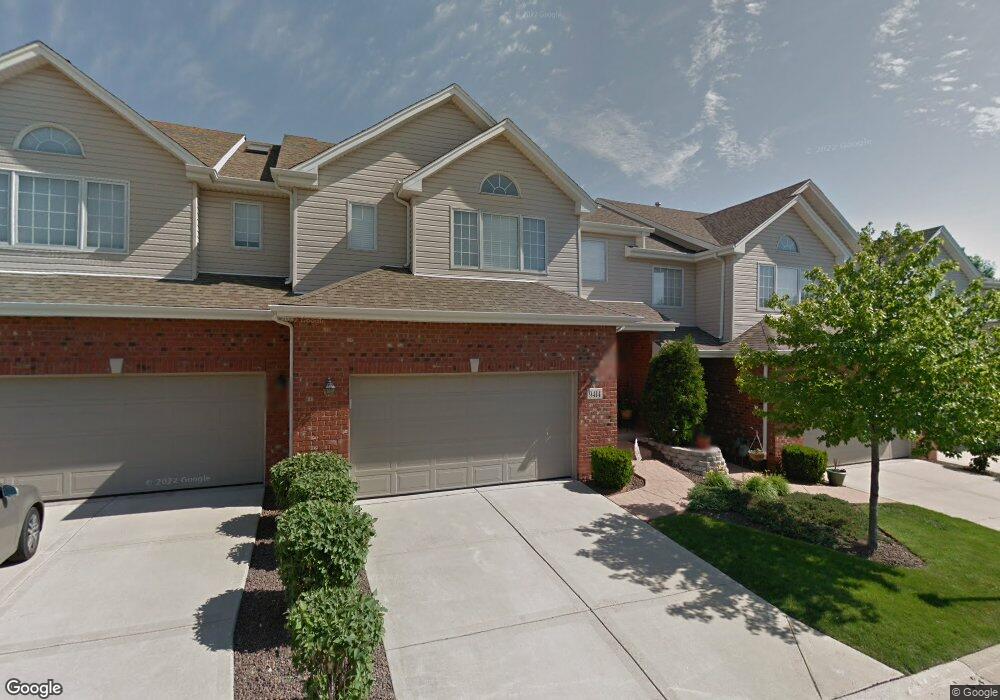
9414 Hitchcock Blvd Tinley Park, IL 60487
Central Tinley Park NeighborhoodEstimated Value: $353,517 - $392,000
3
Beds
4
Baths
1,873
Sq Ft
$200/Sq Ft
Est. Value
About This Home
This home is located at 9414 Hitchcock Blvd, Tinley Park, IL 60487 and is currently estimated at $374,129, approximately $199 per square foot. 9414 Hitchcock Blvd is a home located in Cook County with nearby schools including Christa Mcauliffe School, Prairie View Middle School, and Victor J Andrew High School.
Ownership History
Date
Name
Owned For
Owner Type
Purchase Details
Closed on
Nov 30, 2007
Sold by
Albrecht Rosemary
Bought by
Koros Doria L
Current Estimated Value
Home Financials for this Owner
Home Financials are based on the most recent Mortgage that was taken out on this home.
Original Mortgage
$264,000
Outstanding Balance
$167,187
Interest Rate
6.31%
Mortgage Type
Unknown
Estimated Equity
$206,942
Purchase Details
Closed on
Dec 20, 2004
Sold by
Bos Gerrit and Torpy Cynthia M
Bought by
Albrecht Rosemary
Home Financials for this Owner
Home Financials are based on the most recent Mortgage that was taken out on this home.
Original Mortgage
$178,000
Interest Rate
5.82%
Mortgage Type
Unknown
Purchase Details
Closed on
May 21, 2002
Sold by
Palos Bank & Trust Company
Bought by
Sluis Cynthia M and Bos Gerrit
Home Financials for this Owner
Home Financials are based on the most recent Mortgage that was taken out on this home.
Original Mortgage
$215,600
Interest Rate
6.87%
Create a Home Valuation Report for This Property
The Home Valuation Report is an in-depth analysis detailing your home's value as well as a comparison with similar homes in the area
Home Values in the Area
Average Home Value in this Area
Purchase History
| Date | Buyer | Sale Price | Title Company |
|---|---|---|---|
| Koros Doria L | $330,000 | Pntn | |
| Albrecht Rosemary | $260,000 | Cti | |
| Sluis Cynthia M | $227,000 | Stewart Title |
Source: Public Records
Mortgage History
| Date | Status | Borrower | Loan Amount |
|---|---|---|---|
| Open | Koros Doria L | $264,000 | |
| Previous Owner | Albrecht Rosemary | $178,000 | |
| Previous Owner | Sluis Cynthia M | $215,600 |
Source: Public Records
Tax History Compared to Growth
Tax History
| Year | Tax Paid | Tax Assessment Tax Assessment Total Assessment is a certain percentage of the fair market value that is determined by local assessors to be the total taxable value of land and additions on the property. | Land | Improvement |
|---|---|---|---|---|
| 2024 | $7,131 | $29,000 | $2,471 | $26,529 |
| 2023 | $6,545 | $29,000 | $2,471 | $26,529 |
| 2022 | $6,545 | $21,779 | $2,132 | $19,647 |
| 2021 | $6,365 | $21,778 | $2,131 | $19,647 |
| 2020 | $6,276 | $21,778 | $2,131 | $19,647 |
| 2019 | $6,945 | $24,843 | $1,938 | $22,905 |
| 2018 | $6,794 | $24,843 | $1,938 | $22,905 |
| 2017 | $6,632 | $24,843 | $1,938 | $22,905 |
| 2016 | $6,925 | $23,349 | $1,744 | $21,605 |
| 2015 | $6,810 | $23,349 | $1,744 | $21,605 |
| 2014 | $6,769 | $23,349 | $1,744 | $21,605 |
| 2013 | $6,923 | $25,553 | $1,744 | $23,809 |
Source: Public Records
Map
Nearby Homes
- 17224 Briar Dr
- 9413 Caledonia Dr
- 9334 Drummond Dr Unit 3
- 17018 93rd Ave
- 9201 175th St
- 9260 Windsor Pkwy Unit 80
- 17535-2 Lagrange Rd
- 17535 S La Grange Rd
- 9280 Windsor Pkwy Unit 92
- 17533 Pecan Ln
- 17230 Shetland Dr
- 16950 90th Ave
- 16779 92nd Ave
- 9404 Lindsay St
- 16805 Hilltop Ave
- 16753 91st Ave
- 16701 Highview Ave
- 16753 Hilltop Ave
- 16813 89th Ave
- 17964 Upland Dr
- 9412 Hitchcock Blvd
- 9416 Hitchcock Blvd
- 9410 Hitchcock Blvd
- 9422 Hitchcock Blvd
- 9413 Hitchcock Blvd
- 9424 Hitchcock Blvd
- 9417 173rd St
- 9415 173rd St
- 9413 173rd St
- 9421 173rd St
- 9423 Hitchcock Blvd
- 9423 Hitchcock Blvd Unit 9429
- 9426 Hitchcock Blvd Unit 9426
- 9411 173rd St
- 9406 Hitchcock Blvd
- 9423 173rd St
- 9425 Hitchcock Blvd
- 9404 Hitchcock Blvd
- 9428 Hitchcock Blvd
- 9425 173rd St