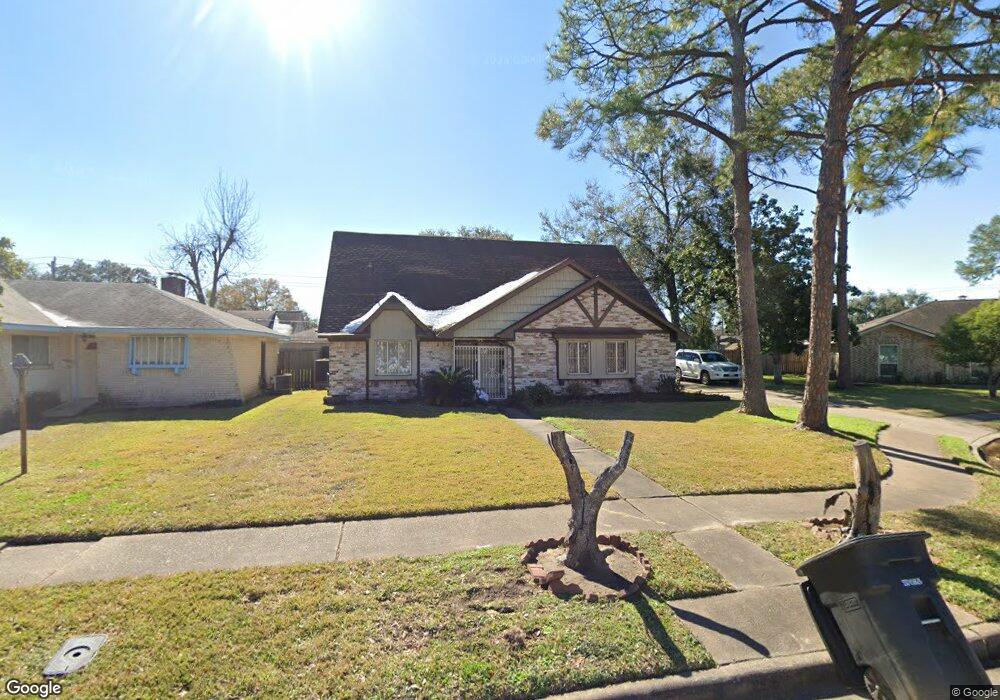
9415 Sharpview Dr Houston, TX 77036
Chinatown NeighborhoodEstimated Value: $317,895 - $358,000
4
Beds
3
Baths
2,412
Sq Ft
$139/Sq Ft
Est. Value
About This Home
This home is located at 9415 Sharpview Dr, Houston, TX 77036 and is currently estimated at $334,974, approximately $138 per square foot. 9415 Sharpview Dr is a home located in Harris County with nearby schools including Ed White Elementary School, Sugar Grove Academy, and Sharpstown High School.
Ownership History
Date
Name
Owned For
Owner Type
Purchase Details
Closed on
Sep 17, 2003
Sold by
Murad Marwan
Bought by
Abukwaik Zaher
Current Estimated Value
Home Financials for this Owner
Home Financials are based on the most recent Mortgage that was taken out on this home.
Original Mortgage
$119,200
Outstanding Balance
$55,297
Interest Rate
6.24%
Mortgage Type
Purchase Money Mortgage
Estimated Equity
$279,677
Purchase Details
Closed on
Oct 27, 1999
Sold by
Equicredit Corp Of America
Bought by
Murad Marwan
Home Financials for this Owner
Home Financials are based on the most recent Mortgage that was taken out on this home.
Original Mortgage
$80,417
Interest Rate
7.77%
Purchase Details
Closed on
Jun 13, 1994
Sold by
Hood John Y B
Bought by
Demarco Daniel C
Purchase Details
Closed on
Feb 4, 1994
Sold by
Adams Joe Don and Adams Wanda G
Bought by
Hood John Y B
Create a Home Valuation Report for This Property
The Home Valuation Report is an in-depth analysis detailing your home's value as well as a comparison with similar homes in the area
Home Values in the Area
Average Home Value in this Area
Purchase History
| Date | Buyer | Sale Price | Title Company |
|---|---|---|---|
| Abukwaik Zaher | -- | North American Title Co | |
| Murad Marwan | -- | Texas American Title Company | |
| Demarco Daniel C | -- | -- | |
| Hood John Y B | -- | -- |
Source: Public Records
Mortgage History
| Date | Status | Borrower | Loan Amount |
|---|---|---|---|
| Open | Abukwaik Zaher | $119,200 | |
| Previous Owner | Murad Marwan | $80,417 | |
| Closed | Abukwaik Zaher | $14,900 |
Source: Public Records
Tax History
| Year | Tax Paid | Tax Assessment Tax Assessment Total Assessment is a certain percentage of the fair market value that is determined by local assessors to be the total taxable value of land and additions on the property. | Land | Improvement |
|---|---|---|---|---|
| 2025 | $4,109 | $298,827 | $102,512 | $196,315 |
| 2024 | $4,109 | $300,249 | $102,512 | $197,737 |
| 2023 | $4,109 | $316,609 | $102,512 | $214,097 |
| 2022 | $5,598 | $273,306 | $59,799 | $213,507 |
| 2021 | $5,198 | $223,018 | $51,256 | $171,762 |
| 2020 | $5,651 | $225,910 | $51,256 | $174,654 |
| 2019 | $5,897 | $225,910 | $51,256 | $174,654 |
| 2018 | $3,908 | $206,947 | $51,256 | $155,691 |
| 2017 | $4,969 | $206,947 | $51,256 | $155,691 |
| 2016 | $4,518 | $188,906 | $51,256 | $137,650 |
| 2015 | $2,794 | $157,443 | $51,256 | $106,187 |
| 2014 | $2,794 | $157,443 | $51,256 | $106,187 |
Source: Public Records
Map
Nearby Homes
- 9610 Tarragon Ln
- 9506 Hendon Ln
- 7723 Kendalia Dr
- 9006 Roos Rd
- 9234 Westwood Village Dr Unit 17
- 7015 Lacy Hill Dr
- 7939 Kendalia Dr
- 9901 Sharpcrest St Unit M6
- 9901 Sharpcrest St Unit B3
- 9264 Westwood Village Dr Unit 32
- 7911 Kendalia Dr
- 7941 Kendalia Dr
- 9201 Clarewood Dr Unit 203
- 9201 Clarewood Dr Unit 245
- 9201 Clarewood Dr Unit 257
- 9201 Clarewood Dr Unit 204
- 9201 Clarewood Dr Unit 284
- 9201 Clarewood Dr Unit 365
- 9345 Westwood Village Dr Unit 30
- 8838 Stroud Dr
- 9411 Sharpview Dr
- 9419 Sharpview Dr
- 9414 Sandstone St
- 9410 Sandstone St
- 9407 Sharpview Dr
- 7314 Eichler Dr
- 9414 Sharpview Dr
- 9406 Sandstone St
- 9403 Sharpview Dr
- 9410 Sharpview Dr
- 7310 Eichler Dr
- 9503 Sharpview Dr
- 9418 Sandstone St
- 9502 Sandstone St
- 9406 Sharpview Dr
- 9402 Sandstone St
- 7306 Eichler Dr
- 9507 Sharpview Dr
- 9323 Sharpview Dr
- 9502 Sharpview Dr
Your Personal Tour Guide
Ask me questions while you tour the home.