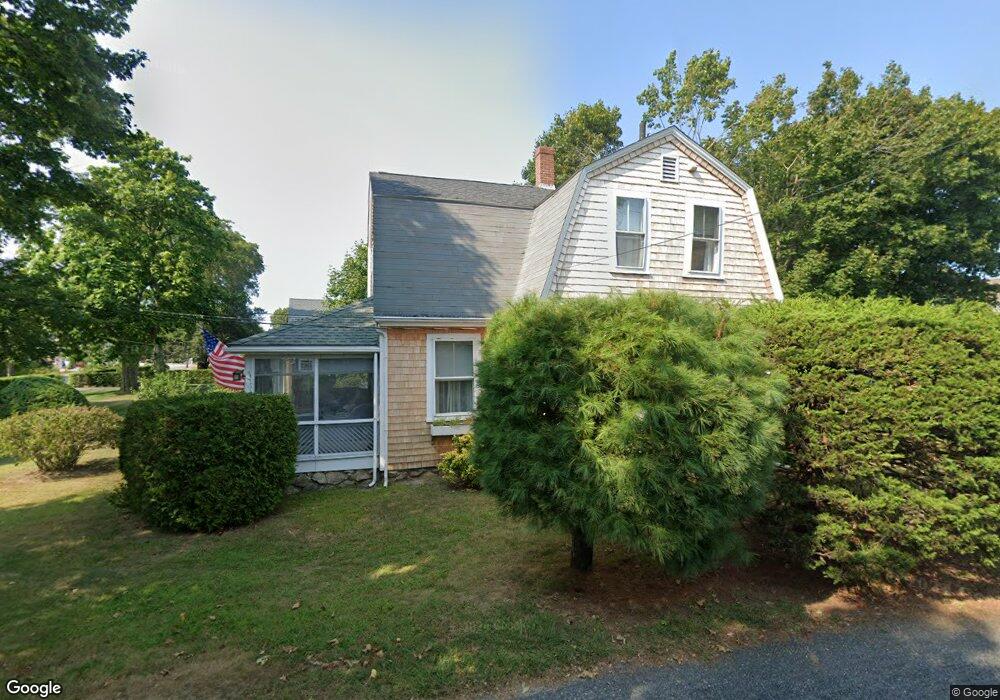
942 Main St Osterville, MA 02655
Osterville NeighborhoodEstimated Value: $798,147 - $1,174,000
3
Beds
1
Bath
1,124
Sq Ft
$845/Sq Ft
Est. Value
About This Home
This home is located at 942 Main St, Osterville, MA 02655 and is currently estimated at $949,287, approximately $844 per square foot. 942 Main St is a home located in Barnstable County with nearby schools including West Villages Elementary School, Barnstable United Elementary School, and Barnstable Intermediate School.
Ownership History
Date
Name
Owned For
Owner Type
Purchase Details
Closed on
Aug 4, 2022
Sold by
Smith June B
Bought by
Smith Albert
Current Estimated Value
Purchase Details
Closed on
May 2, 2008
Sold by
Smith Albert and Smith June B
Bought by
Smith Albert
Purchase Details
Closed on
Apr 10, 1998
Sold by
West Side T
Bought by
West Side Pl Lc
Home Financials for this Owner
Home Financials are based on the most recent Mortgage that was taken out on this home.
Original Mortgage
$337,500
Interest Rate
6.98%
Mortgage Type
Purchase Money Mortgage
Create a Home Valuation Report for This Property
The Home Valuation Report is an in-depth analysis detailing your home's value as well as a comparison with similar homes in the area
Home Values in the Area
Average Home Value in this Area
Purchase History
| Date | Buyer | Sale Price | Title Company |
|---|---|---|---|
| Smith Albert | -- | None Available | |
| Smith Albert | -- | -- | |
| West Side Pl Lc | $410,000 | -- |
Source: Public Records
Mortgage History
| Date | Status | Borrower | Loan Amount |
|---|---|---|---|
| Previous Owner | West Side Pl Lc | $337,500 |
Source: Public Records
Tax History Compared to Growth
Tax History
| Year | Tax Paid | Tax Assessment Tax Assessment Total Assessment is a certain percentage of the fair market value that is determined by local assessors to be the total taxable value of land and additions on the property. | Land | Improvement |
|---|---|---|---|---|
| 2025 | $5,390 | $666,300 | $443,900 | $222,400 |
| 2024 | $5,080 | $650,400 | $443,900 | $206,500 |
| 2023 | $4,058 | $486,600 | $312,400 | $174,200 |
| 2022 | $3,907 | $405,300 | $265,200 | $140,100 |
| 2021 | $3,888 | $370,600 | $241,100 | $129,500 |
| 2020 | $3,781 | $345,000 | $241,100 | $103,900 |
| 2019 | $1,697 | $345,000 | $241,100 | $103,900 |
| 2018 | $1,521 | $351,300 | $263,900 | $87,400 |
| 2017 | $1,475 | $357,900 | $274,100 | $83,800 |
| 2016 | $4,004 | $367,300 | $283,500 | $83,800 |
| 2015 | $3,947 | $363,800 | $267,500 | $96,300 |
Source: Public Records
Map
Nearby Homes
- 920 Main St Unit 1 Building 2
- 920 Main St Unit 2-1
- 39 Tower Hill Rd Unit 1C
- 64 Bay St
- 77 Robbins St
- 98 Bunker Hill Rd
- 177 Bayview Cir
- 16 2nd Ave Unit 5A
- 199 E Bay Rd Unit 13
- 369 Bumps River Rd
- 51 Wianno Cir
- 435 Old Mill Rd
- 355 Bridge St
- 268 Bumps River Rd
- 89 Swift Ave
- 81 Falling Leaf Ln
- 37 Old Salem Way
- 25 Sturbridge Dr
- 60 Smoke Valley Rd
- 950 Main St
- 935 Main St
- 937 Main St
- 2 Gallery Place
- 962 Main St
- 955 Main St
- 39 Blossom Ave Unit 6
- 39 Blossom Ave Unit 7
- 39 Blossom Ave Unit 9
- 39 Blossom Ave Unit 8
- 39 Blossom Ave Unit 5
- 39 Blossom Ave Unit 4
- 39 Blossom Ave Unit 3
- 39 Blossom Ave Unit 2
- 39 Blossom Ave Unit 1
- 39 Blossom Ave
- 945 Main St
- 27 Blossom Ave Unit 8B
- 26 Blossom Ave
- 933 Main St