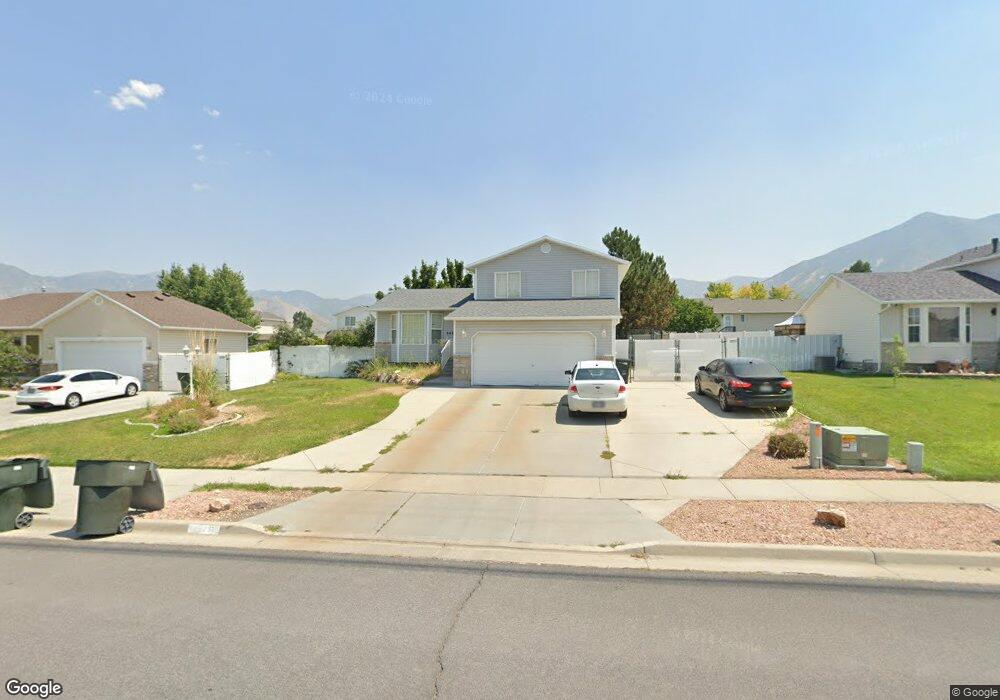
942 N 1250 E Tooele, UT 84074
Estimated Value: $418,000 - $446,000
5
Beds
3
Baths
1,960
Sq Ft
$220/Sq Ft
Est. Value
About This Home
This home is located at 942 N 1250 E, Tooele, UT 84074 and is currently estimated at $431,740, approximately $220 per square foot. 942 N 1250 E is a home located in Tooele County with nearby schools including Middle Canyon Elementary School, Tooele Junior High School, and Tooele High School.
Ownership History
Date
Name
Owned For
Owner Type
Purchase Details
Closed on
Jun 3, 2014
Sold by
Shaffer Rocky G and Shaffer Joanna K
Bought by
Newbold Justin B
Current Estimated Value
Home Financials for this Owner
Home Financials are based on the most recent Mortgage that was taken out on this home.
Original Mortgage
$199,489
Outstanding Balance
$152,134
Interest Rate
4.27%
Mortgage Type
New Conventional
Estimated Equity
$279,606
Purchase Details
Closed on
Sep 17, 2010
Sold by
Shaffer Rocky Gene
Bought by
Shaffer Rocky G and Shaffer Joanna K
Home Financials for this Owner
Home Financials are based on the most recent Mortgage that was taken out on this home.
Original Mortgage
$185,836
Interest Rate
4.51%
Mortgage Type
VA
Purchase Details
Closed on
Sep 2, 2010
Sold by
Steele Mark D and Steele Jonna D
Bought by
Shaffer Rocky Gene
Home Financials for this Owner
Home Financials are based on the most recent Mortgage that was taken out on this home.
Original Mortgage
$185,836
Interest Rate
4.51%
Mortgage Type
VA
Create a Home Valuation Report for This Property
The Home Valuation Report is an in-depth analysis detailing your home's value as well as a comparison with similar homes in the area
Home Values in the Area
Average Home Value in this Area
Purchase History
| Date | Buyer | Sale Price | Title Company |
|---|---|---|---|
| Newbold Justin B | -- | Cornerstone Title | |
| Shaffer Rocky G | -- | None Available | |
| Shaffer Rocky Gene | -- | First American Title Ins Ag |
Source: Public Records
Mortgage History
| Date | Status | Borrower | Loan Amount |
|---|---|---|---|
| Open | Newbold Justin B | $199,489 | |
| Previous Owner | Shaffer Rocky Gene | $185,836 |
Source: Public Records
Tax History Compared to Growth
Tax History
| Year | Tax Paid | Tax Assessment Tax Assessment Total Assessment is a certain percentage of the fair market value that is determined by local assessors to be the total taxable value of land and additions on the property. | Land | Improvement |
|---|---|---|---|---|
| 2025 | $2,794 | $233,058 | $57,750 | $175,308 |
| 2024 | $2,963 | $226,182 | $57,750 | $168,432 |
| 2023 | $2,963 | $219,554 | $54,996 | $164,558 |
| 2022 | $2,696 | $231,987 | $55,000 | $176,987 |
| 2021 | $2,198 | $158,144 | $22,000 | $136,144 |
| 2020 | $2,107 | $263,004 | $40,000 | $223,004 |
| 2019 | $1,977 | $242,731 | $40,000 | $202,731 |
| 2018 | $1,819 | $211,806 | $40,000 | $171,806 |
| 2017 | $1,525 | $210,624 | $30,000 | $180,624 |
| 2016 | $1,246 | $102,885 | $16,500 | $86,385 |
| 2015 | $1,246 | $90,600 | $0 | $0 |
| 2014 | -- | $90,600 | $0 | $0 |
Source: Public Records
Map
Nearby Homes