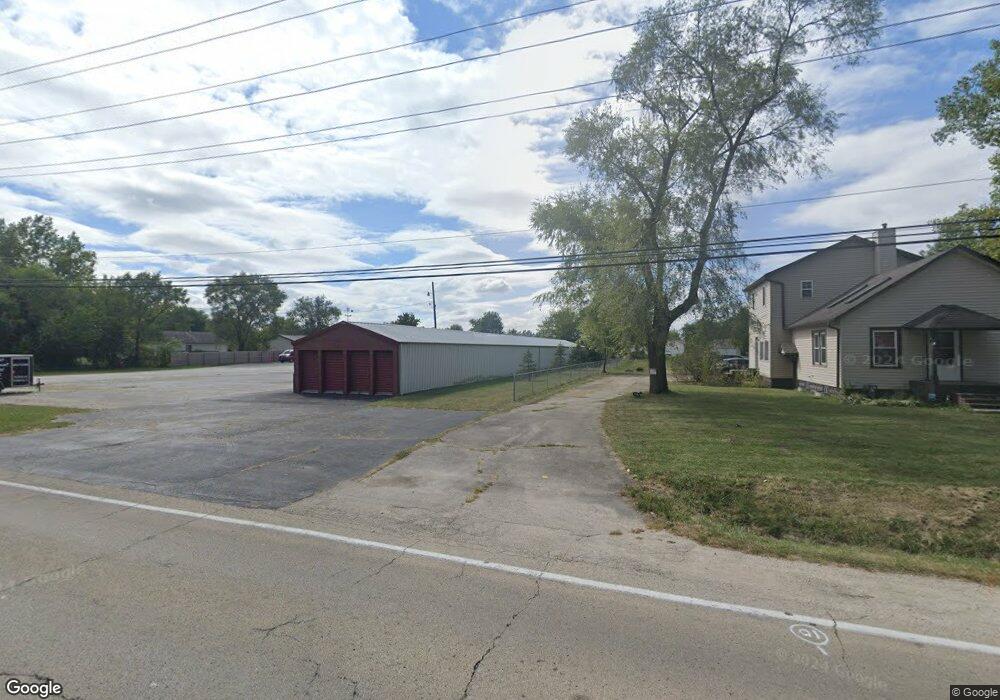
942 N Division St Braidwood, IL 60408
Estimated Value: $204,000
--
Bed
--
Bath
--
Sq Ft
0.53
Acres
About This Home
This home is located at 942 N Division St, Braidwood, IL 60408 and is currently priced at $204,000. 942 N Division St is a home located in Will County with nearby schools including Reed-Custer Intermediate School, Reed-Custer Middle School, and Reed-Custer High School.
Ownership History
Date
Name
Owned For
Owner Type
Purchase Details
Closed on
Aug 19, 2021
Sold by
Wilkerson Timothy J
Bought by
Tec Holdings Llc
Current Estimated Value
Purchase Details
Closed on
Jun 2, 2021
Sold by
John Dixon Iii Inc
Bought by
Wilkerson Timothy J
Home Financials for this Owner
Home Financials are based on the most recent Mortgage that was taken out on this home.
Original Mortgage
$400,000
Interest Rate
2.9%
Mortgage Type
Future Advance Clause Open End Mortgage
Purchase Details
Closed on
Mar 30, 2020
Sold by
Hazecamp Linda S and Estate Of James R Gustafson
Bought by
John Dixon Iii Inc
Home Financials for this Owner
Home Financials are based on the most recent Mortgage that was taken out on this home.
Original Mortgage
$336,000
Interest Rate
3.4%
Mortgage Type
Commercial
Purchase Details
Closed on
Mar 31, 2010
Sold by
Metz Phillip B
Bought by
Gustafson James
Purchase Details
Closed on
Mar 28, 1995
Sold by
Lleshi Gasmend and Lleshi Mamudije
Bought by
Lleshi Gasmend
Create a Home Valuation Report for This Property
The Home Valuation Report is an in-depth analysis detailing your home's value as well as a comparison with similar homes in the area
Home Values in the Area
Average Home Value in this Area
Purchase History
| Date | Buyer | Sale Price | Title Company |
|---|---|---|---|
| Tec Holdings Llc | -- | None Available | |
| Wilkerson Timothy J | $270,000 | Fidelity National Ttl Ins Co | |
| John Dixon Iii Inc | $210,000 | Chicago Title Ins Co | |
| Gustafson James | $150,000 | None Available | |
| Lleshi Gasmend | -- | -- |
Source: Public Records
Mortgage History
| Date | Status | Borrower | Loan Amount |
|---|---|---|---|
| Previous Owner | Wilkerson Timothy J | $400,000 | |
| Previous Owner | John Dixon Iii Inc | $336,000 |
Source: Public Records
Tax History Compared to Growth
Tax History
| Year | Tax Paid | Tax Assessment Tax Assessment Total Assessment is a certain percentage of the fair market value that is determined by local assessors to be the total taxable value of land and additions on the property. | Land | Improvement |
|---|---|---|---|---|
| 2024 | $2,097 | $31,151 | $13,391 | $17,760 |
| 2023 | $2,097 | $31,151 | $13,391 | $17,760 |
| 2022 | $2,158 | $31,151 | $13,391 | $17,760 |
| 2021 | $2,195 | $31,151 | $13,391 | $17,760 |
| 2020 | $2,199 | $31,151 | $13,391 | $17,760 |
| 2019 | $2,207 | $31,151 | $13,391 | $17,760 |
| 2018 | $2,225 | $31,151 | $13,391 | $17,760 |
| 2017 | $2,231 | $31,151 | $13,391 | $17,760 |
| 2016 | $2,254 | $31,151 | $13,391 | $17,760 |
| 2015 | $2,087 | $31,151 | $13,391 | $17,760 |
| 2014 | $2,087 | $31,151 | $13,391 | $17,760 |
| 2013 | $2,087 | $31,151 | $13,391 | $17,760 |
Source: Public Records
Map
Nearby Homes
- 430 W 7th St
- 495 W 6th St
- 605 N Division St
- 584 N Division St
- 0000 N Division St
- 642 W Bergera Rd
- 495 N Division St
- 470 N Walker St
- 466 N Walker St
- 837 Blackhawk Dr
- 460 N School St
- 470 N School St
- 571 N Lincoln St
- 886 Western Ave
- 340 N Walker St
- 999 W Cermak Rd
- 1021 W Cermak Rd
- 1034 Madison Ave
- 1018 Madison Ave
- 203 E Coal City Rd
- 929 N Mabel Ct
- 945 N Mabel Ct
- 548 W Anndon St
- 580 W Anndon St
- 508 W Anndon St
- 956 N Division St
- 920 N Mabel Ct
- 920 N Mabel Ct
- 934 N Mabel Ct
- 902 N Mabel Ct
- 620 W Anndon St
- 956 N Mabel Ct
- 543 W Anndon St
- 575 W Anndon St
- 597 W Anndon St
- 511 W Anndon St
- 978 N Mabel Ct
- Lot 1 N Division St
- Lot 2 N Division St
- 496 W Anndon St