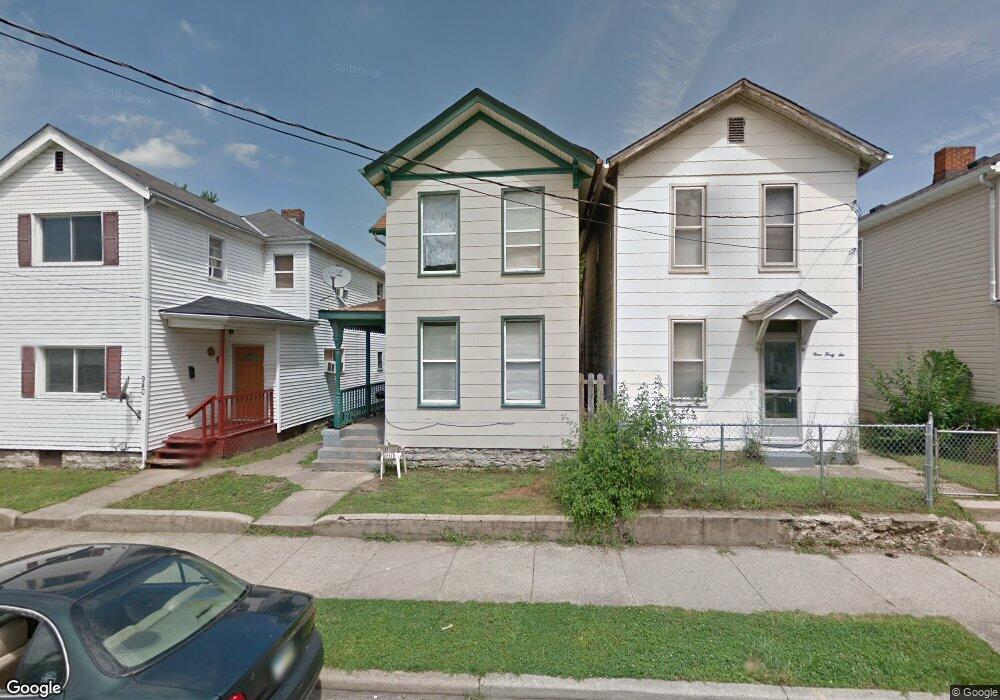
942 Vine St Hamilton, OH 45011
East Hamilton NeighborhoodEstimated Value: $60,000 - $131,000
3
Beds
1
Bath
1,344
Sq Ft
$74/Sq Ft
Est. Value
About This Home
This home is located at 942 Vine St, Hamilton, OH 45011 and is currently estimated at $100,032, approximately $74 per square foot. 942 Vine St is a home located in Butler County with nearby schools including Fairwood Elementary School, Garfield Middle School, and Hamilton Freshman School.
Ownership History
Date
Name
Owned For
Owner Type
Purchase Details
Closed on
Feb 2, 2022
Sold by
Burnett Group Llc
Bought by
Southfield Properties Llc
Current Estimated Value
Purchase Details
Closed on
Jun 28, 2021
Sold by
Smabeles Llc
Bought by
Burnett Group Llc
Purchase Details
Closed on
Feb 1, 2019
Sold by
Abeles Stacy M and Sweetman Paul
Bought by
Smabeles Llc
Purchase Details
Closed on
Jun 1, 1991
Purchase Details
Closed on
Oct 1, 1990
Create a Home Valuation Report for This Property
The Home Valuation Report is an in-depth analysis detailing your home's value as well as a comparison with similar homes in the area
Home Values in the Area
Average Home Value in this Area
Purchase History
| Date | Buyer | Sale Price | Title Company |
|---|---|---|---|
| Southfield Properties Llc | -- | Fingerman Debra M | |
| Burnett Group Llc | $37,000 | None Available | |
| Burnett Group Llc | $37,000 | None Listed On Document | |
| Smabeles Llc | -- | None Available | |
| -- | $15,400 | -- | |
| -- | $8,000 | -- |
Source: Public Records
Tax History
| Year | Tax Paid | Tax Assessment Tax Assessment Total Assessment is a certain percentage of the fair market value that is determined by local assessors to be the total taxable value of land and additions on the property. | Land | Improvement |
|---|---|---|---|---|
| 2025 | $1,245 | $26,390 | $2,920 | $23,470 |
| 2024 | $1,245 | $26,390 | $2,920 | $23,470 |
| 2023 | $1,187 | $26,390 | $2,920 | $23,470 |
| 2022 | $1,792 | $21,210 | $2,920 | $18,290 |
| 2021 | $999 | $20,440 | $2,920 | $17,520 |
| 2020 | $1,038 | $20,440 | $2,920 | $17,520 |
| 2019 | $860 | $16,530 | $2,800 | $13,730 |
| 2018 | $839 | $16,530 | $2,800 | $13,730 |
| 2017 | $846 | $16,530 | $2,800 | $13,730 |
| 2016 | $878 | $16,400 | $2,800 | $13,600 |
| 2015 | $825 | $16,400 | $2,800 | $13,600 |
| 2014 | $741 | $16,400 | $2,800 | $13,600 |
| 2013 | $741 | $14,650 | $2,800 | $11,850 |
Source: Public Records
Map
Nearby Homes