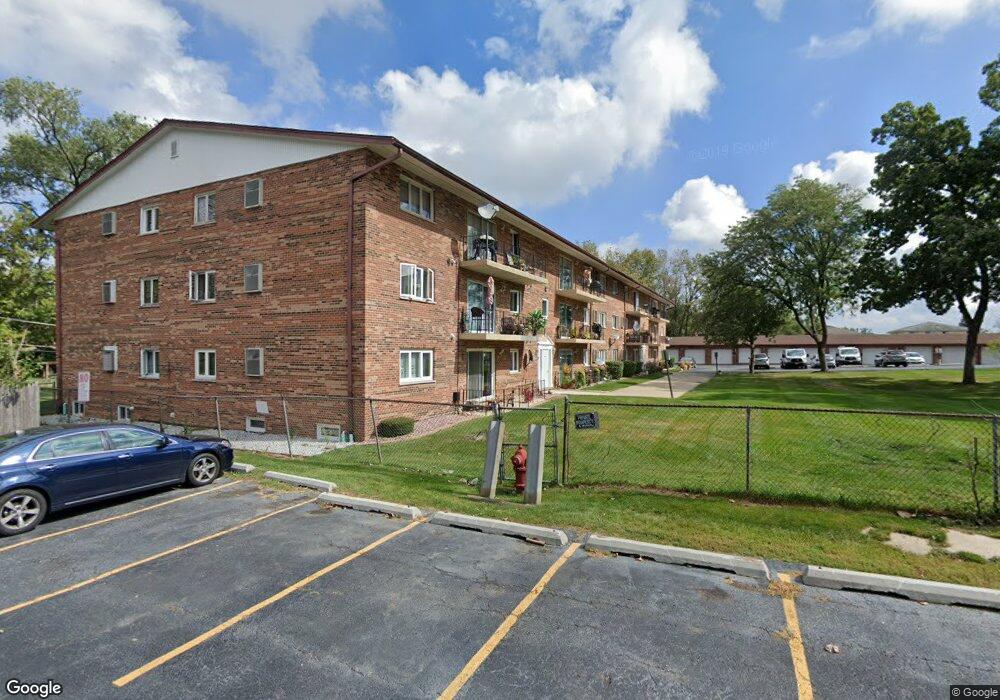
9420 Greenbriar Dr Unit 1C Hickory Hills, IL 60457
Estimated Value: $206,334 - $253,000
2
Beds
2
Baths
30,267
Sq Ft
$8/Sq Ft
Est. Value
About This Home
This home is located at 9420 Greenbriar Dr Unit 1C, Hickory Hills, IL 60457 and is currently estimated at $227,584, approximately $7 per square foot. 9420 Greenbriar Dr Unit 1C is a home located in Cook County with nearby schools including Dorn Elementary School, Glen Oaks Elementary School, and H H Conrady Jr High School.
Ownership History
Date
Name
Owned For
Owner Type
Purchase Details
Closed on
Sep 30, 2010
Sold by
Reichard James E and Reichard Jennifer
Bought by
Odonnell Patrick M and Odonnell Linda J
Current Estimated Value
Purchase Details
Closed on
Nov 13, 2007
Sold by
Martin Vilma
Bought by
Reichard James E
Home Financials for this Owner
Home Financials are based on the most recent Mortgage that was taken out on this home.
Original Mortgage
$164,450
Interest Rate
6.45%
Mortgage Type
Unknown
Purchase Details
Closed on
Sep 1, 2004
Sold by
Jakubauskiene Lina
Bought by
Martin Vilma
Home Financials for this Owner
Home Financials are based on the most recent Mortgage that was taken out on this home.
Original Mortgage
$101,600
Interest Rate
6.87%
Mortgage Type
New Conventional
Purchase Details
Closed on
Apr 1, 1994
Sold by
Slowik Dennis F
Bought by
Jurksaitis Martha and Schneider Oswald
Create a Home Valuation Report for This Property
The Home Valuation Report is an in-depth analysis detailing your home's value as well as a comparison with similar homes in the area
Home Values in the Area
Average Home Value in this Area
Purchase History
| Date | Buyer | Sale Price | Title Company |
|---|---|---|---|
| Odonnell Patrick M | $163,500 | Fidelity National Title | |
| Reichard James E | $164,500 | Chicago Title Insurance Co | |
| Martin Vilma | $127,000 | First American | |
| Jurksaitis Martha | $60,000 | -- |
Source: Public Records
Mortgage History
| Date | Status | Borrower | Loan Amount |
|---|---|---|---|
| Previous Owner | Reichard James E | $164,450 | |
| Previous Owner | Martin Vilma | $101,600 | |
| Closed | Martin Vilma | $25,400 |
Source: Public Records
Tax History Compared to Growth
Tax History
| Year | Tax Paid | Tax Assessment Tax Assessment Total Assessment is a certain percentage of the fair market value that is determined by local assessors to be the total taxable value of land and additions on the property. | Land | Improvement |
|---|---|---|---|---|
| 2024 | $3,403 | $16,987 | $1,849 | $15,138 |
| 2023 | $1,921 | $17,141 | $1,849 | $15,292 |
| 2022 | $1,921 | $11,203 | $3,698 | $7,505 |
| 2021 | $1,881 | $11,202 | $3,698 | $7,504 |
| 2020 | $2,861 | $11,202 | $3,698 | $7,504 |
| 2019 | $1,406 | $7,402 | $3,379 | $4,023 |
| 2018 | $1,373 | $7,402 | $3,379 | $4,023 |
| 2017 | $1,341 | $7,402 | $3,379 | $4,023 |
| 2016 | $1,789 | $7,471 | $2,933 | $4,538 |
| 2015 | $2,044 | $8,416 | $2,933 | $5,483 |
| 2014 | $2,036 | $8,416 | $2,933 | $5,483 |
| 2013 | $2,836 | $11,337 | $2,933 | $8,404 |
Source: Public Records
Map
Nearby Homes
- 8604 W 95th St Unit 102
- 9300 S 83rd Ct
- 9160 S 88th Ct
- 8900 W 93rd St
- 8606 S 84th Ave
- 9050 S 84th Ave
- 9004 Del Prado Dr Unit 2N
- 9026 Del Prado Dr Unit 2N
- 9317 S 82nd Ave
- 9013 W 91st Place
- 9047 W Oak Crest Ct
- 8931 S 83rd Ct
- 9150 W 95th St Unit 2B
- 8832 Pleasant Ave
- 9954 S 84th Terrace Unit 109
- 9970 S 84th Terrace Unit 216-B
- 9950 S 84th Terrace Unit 215
- 8990 W 99th St
- 9937 S 88th Ave
- 9407 S Roberts Rd Unit 3SE
- 9420 Greenbriar Dr Unit 2B
- 9420 Greenbriar Dr Unit 2A
- 9420 Greenbriar Dr Unit 1E
- 9420 Greenbriar Dr Unit G23
- 9420 Greenbriar Dr Unit 3B
- 9420 Greenbriar Dr Unit 3C
- 9420 Greenbriar Dr Unit 3E
- 9420 Greenbriar Dr Unit 1G
- 9420 Greenbriar Dr Unit 1F
- 9420 Greenbriar Dr Unit G11
- 9420 Greenbriar Dr Unit G4
- 9420 Greenbriar Dr Unit G10
- 9420 Greenbriar Dr Unit G12
- 9420 Greenbriar Dr Unit G20
- 9420 Greenbriar Dr Unit G6
- 9420 Greenbriar Dr Unit G9
- 9420 Greenbriar Dr Unit G8
- 9420 Greenbriar Dr Unit 3F
- 9420 Greenbriar Dr Unit 1D
- 9420 Greenbriar Dr Unit G22