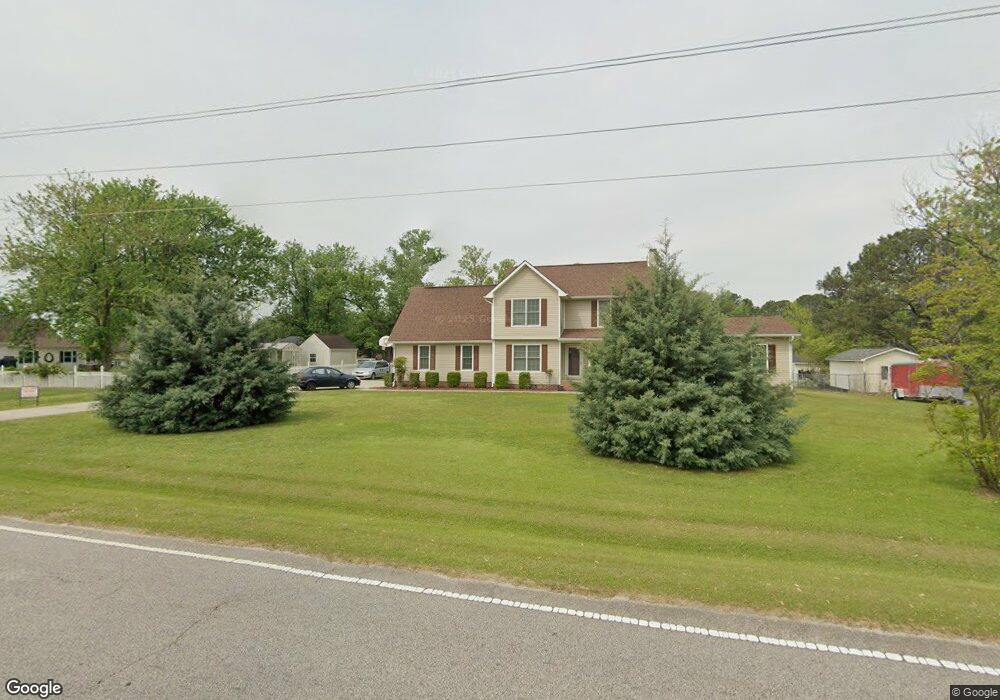
9420 Purfoy Rd Fuquay Varina, NC 27526
Estimated Value: $407,000 - $499,447
3
Beds
3
Baths
1,848
Sq Ft
$240/Sq Ft
Est. Value
About This Home
This home is located at 9420 Purfoy Rd, Fuquay Varina, NC 27526 and is currently estimated at $444,112, approximately $240 per square foot. 9420 Purfoy Rd is a home located in Wake County with nearby schools including Carolina Charter Academy, Achievement Charter Academy, and Learning Time Academy.
Ownership History
Date
Name
Owned For
Owner Type
Purchase Details
Closed on
Mar 22, 2016
Sold by
Goodmortgage
Bought by
Baker Charles
Current Estimated Value
Home Financials for this Owner
Home Financials are based on the most recent Mortgage that was taken out on this home.
Original Mortgage
$152,000
Outstanding Balance
$120,626
Interest Rate
3.73%
Estimated Equity
$323,486
Purchase Details
Closed on
Aug 25, 1998
Sold by
Johnson James W and Johnson Connie A
Bought by
Baker Charles A and Baker Sonya P
Home Financials for this Owner
Home Financials are based on the most recent Mortgage that was taken out on this home.
Original Mortgage
$120,000
Interest Rate
6.92%
Purchase Details
Closed on
Jan 2, 1998
Sold by
Stanback Arthur L
Bought by
Norris Danny E and Johnson James W
Create a Home Valuation Report for This Property
The Home Valuation Report is an in-depth analysis detailing your home's value as well as a comparison with similar homes in the area
Home Values in the Area
Average Home Value in this Area
Purchase History
| Date | Buyer | Sale Price | Title Company |
|---|---|---|---|
| Baker Charles | -- | -- | |
| Baker Charles A | $150,000 | -- | |
| Norris Danny E | $8,962 | -- |
Source: Public Records
Mortgage History
| Date | Status | Borrower | Loan Amount |
|---|---|---|---|
| Open | Baker Charles | $152,000 | |
| Closed | Baker Charles | -- | |
| Previous Owner | Baker Charles | $131,000 | |
| Previous Owner | Baker Charles | $30,000 | |
| Previous Owner | Baker Charles A | $120,000 | |
| Closed | Baker Charles A | $15,000 |
Source: Public Records
Tax History Compared to Growth
Tax History
| Year | Tax Paid | Tax Assessment Tax Assessment Total Assessment is a certain percentage of the fair market value that is determined by local assessors to be the total taxable value of land and additions on the property. | Land | Improvement |
|---|---|---|---|---|
| 2025 | $2,948 | $457,782 | $120,000 | $337,782 |
| 2024 | $2,863 | $457,782 | $120,000 | $337,782 |
| 2023 | $2,043 | $259,426 | $50,400 | $209,026 |
| 2022 | $1,739 | $238,031 | $50,400 | $187,631 |
| 2021 | $1,624 | $228,331 | $50,400 | $177,931 |
| 2020 | $1,598 | $228,331 | $50,400 | $177,931 |
| 2019 | $1,555 | $187,894 | $45,000 | $142,894 |
| 2018 | $1,430 | $187,894 | $45,000 | $142,894 |
| 2017 | $1,356 | $187,894 | $45,000 | $142,894 |
| 2016 | $1,329 | $187,894 | $45,000 | $142,894 |
| 2015 | $1,346 | $190,924 | $48,000 | $142,924 |
| 2014 | -- | $190,924 | $48,000 | $142,924 |
Source: Public Records
Map
Nearby Homes
- 148 Gilmer St
- 147 Gilmer St
- 177 Gilmer St
- 194 Gilmer St
- 128 Gilmer St
- 164 Gilmer St
- NORMAN Plan at Eagle Creek
- LAWSON Plan at Eagle Creek
- EDISTO Plan at Eagle Creek
- KATHRYN Plan at Eagle Creek
- HARTWELL Plan at Eagle Creek
- 56 Greenwillow Dr
- 104 Gilmer St
- 163 Gilmer St
- 3825 Wyndfair Dr
- 191 Gilmer St
- 209 Gilmer St
- 8529 Kenridge Ln
- 1471 Carlton Links Dr
- 341 Delmoor Dr
- 9416 Purfoy Rd
- 4000 Traverse Dr
- 4004 Traverse Dr
- 9417 Purfoy Rd
- 9409 Purfoy Rd
- 9408 Purfoy Rd
- 9425 Purfoy Rd
- 4008 Traverse Dr
- 2130 Angier Rd
- 9405 Purfoy Rd
- 4001 Traverse Dr
- 9433 Purfoy Rd
- 2126 Angier Rd
- 2028 Angier Rd
- 4012 Traverse Dr
- 4009 Traverse Dr
- 2124 Angier Rd
- 2024 Angier Rd
- 4013 Traverse Dr
- 1028 Jensen Grove Ct