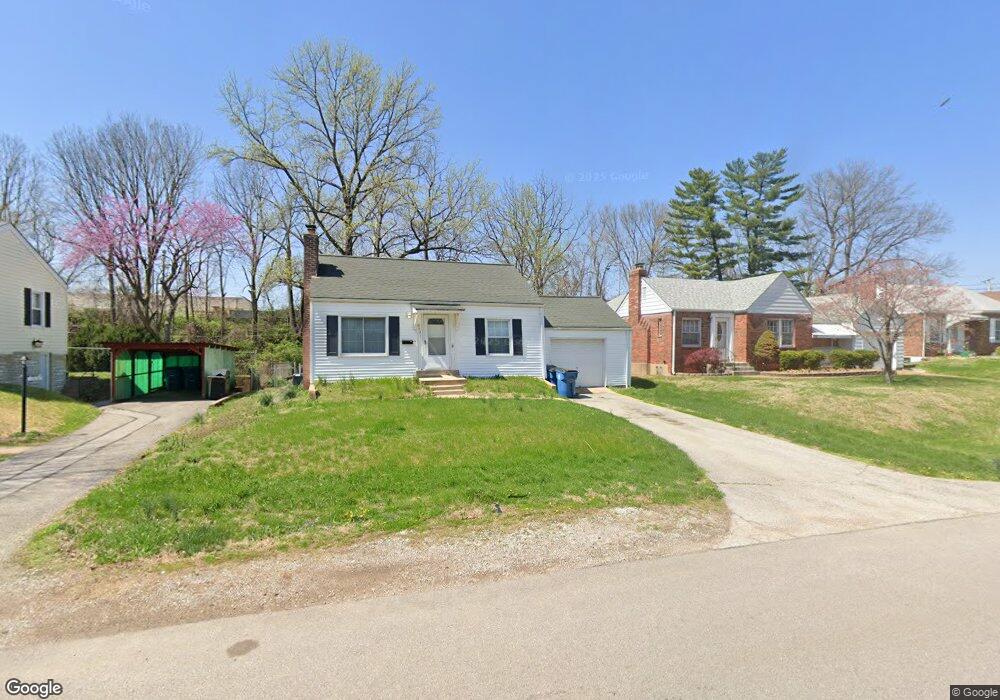
9421 Brenda Ave Saint Louis, MO 63123
Estimated Value: $161,000 - $193,000
2
Beds
1
Bath
840
Sq Ft
$211/Sq Ft
Est. Value
About This Home
This home is located at 9421 Brenda Ave, Saint Louis, MO 63123 and is currently estimated at $177,605, approximately $211 per square foot. 9421 Brenda Ave is a home located in St. Louis County with nearby schools including Mesnier Primary School, Gotsch Intermediate School, and Rogers Middle School.
Ownership History
Date
Name
Owned For
Owner Type
Purchase Details
Closed on
Sep 11, 2024
Sold by
Brouk Gregory W and Brouk Angela L
Bought by
Olin Lesley and Olin Tasha
Current Estimated Value
Home Financials for this Owner
Home Financials are based on the most recent Mortgage that was taken out on this home.
Original Mortgage
$117,600
Outstanding Balance
$116,278
Interest Rate
6.47%
Mortgage Type
New Conventional
Estimated Equity
$61,327
Purchase Details
Closed on
Aug 13, 1998
Sold by
Saaman Corp
Bought by
Brouk Gregory W and Brouk Angela L
Home Financials for this Owner
Home Financials are based on the most recent Mortgage that was taken out on this home.
Original Mortgage
$56,700
Interest Rate
6.95%
Purchase Details
Closed on
Jun 12, 1998
Sold by
Decker Dale R and Decker Sandra M
Bought by
Saaman Corp
Home Financials for this Owner
Home Financials are based on the most recent Mortgage that was taken out on this home.
Original Mortgage
$56,000
Interest Rate
7.21%
Create a Home Valuation Report for This Property
The Home Valuation Report is an in-depth analysis detailing your home's value as well as a comparison with similar homes in the area
Home Values in the Area
Average Home Value in this Area
Purchase History
| Date | Buyer | Sale Price | Title Company |
|---|---|---|---|
| Olin Lesley | -- | Freedom Title | |
| Brouk Gregory W | $63,000 | -- | |
| Saaman Corp | -- | -- |
Source: Public Records
Mortgage History
| Date | Status | Borrower | Loan Amount |
|---|---|---|---|
| Open | Olin Lesley | $117,600 | |
| Previous Owner | Brouk Gregory W | $56,700 | |
| Previous Owner | Saaman Corp | $56,000 |
Source: Public Records
Tax History Compared to Growth
Tax History
| Year | Tax Paid | Tax Assessment Tax Assessment Total Assessment is a certain percentage of the fair market value that is determined by local assessors to be the total taxable value of land and additions on the property. | Land | Improvement |
|---|---|---|---|---|
| 2025 | $2,141 | $32,360 | $14,160 | $18,200 |
| 2024 | $2,141 | $26,260 | $10,110 | $16,150 |
| 2023 | $2,070 | $26,260 | $10,110 | $16,150 |
| 2022 | $2,260 | $24,590 | $10,110 | $14,480 |
| 2021 | $2,063 | $24,590 | $10,110 | $14,480 |
| 2020 | $1,843 | $20,460 | $9,800 | $10,660 |
| 2019 | $1,839 | $20,460 | $9,800 | $10,660 |
| 2018 | $1,837 | $18,070 | $6,840 | $11,230 |
| 2017 | $1,826 | $18,070 | $6,840 | $11,230 |
| 2016 | $1,624 | $17,060 | $4,560 | $12,500 |
| 2015 | $1,631 | $17,060 | $4,560 | $12,500 |
| 2014 | $2,296 | $24,040 | $4,370 | $19,670 |
Source: Public Records
Map
Nearby Homes
- 9347 Mackenzie Rd
- 9702 Sterling Place
- 9504 Cloverhurst Dr
- 9409 Alpine Dr
- 9723 Crayford Rd Unit 1B
- 9529 MacKenzie Circle Dr
- 9740 Bexley Station Dr
- 9744 Bexley Station Dr Unit 8J
- 9332 Cloverhurst Dr
- 9425 MacKenzie Circle Ct
- 9327 Cloverhurst Dr
- 9506 Sterling Place
- 6426 Judson Ave
- 8740 Brenda Ave
- 8942 Eden Ave
- 8736 New Hampshire Ave
- 9117 Tiber Ct
- 9108 Tiber Ct
- 8554 Palmetto Dr
- 9928 Bonton Dr
- 9415 Brenda Ave
- 9409 Brenda Ave
- 9429 Brenda Ave
- 9405 Brenda Ave
- 9433 Brenda Ave
- 9426 Brenda Ave
- 9428 Brenda Ave
- 9414 Brenda Ave
- 9430 Brenda Ave
- 9410 Brenda Ave
- 9437 Brenda Ave
- 9434 Brenda Ave
- 9406 Brenda Ave
- 9353 Brenda Ave
- 9441 Brenda Ave
- 9438 Brenda Ave
- 9703 Pauline Place
- 9707 Pauline Place
- 9415 Mackenzie Rd