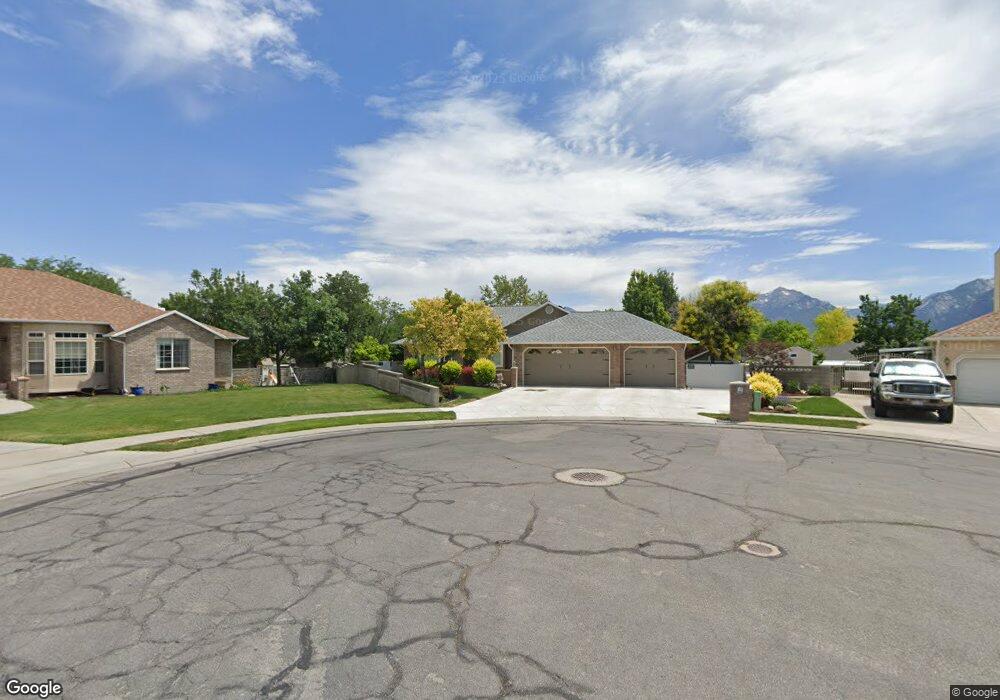
9421 S Spring Willow Cir South Jordan, UT 84095
Estimated Value: $756,000 - $803,000
6
Beds
3
Baths
3,564
Sq Ft
$220/Sq Ft
Est. Value
About This Home
This home is located at 9421 S Spring Willow Cir, South Jordan, UT 84095 and is currently estimated at $785,374, approximately $220 per square foot. 9421 S Spring Willow Cir is a home located in Salt Lake County with nearby schools including Jordan Ridge School, South Jordan Middle School, and Hawthorn Academy.
Ownership History
Date
Name
Owned For
Owner Type
Purchase Details
Closed on
Jan 27, 2021
Sold by
Schiele Paul and Schiele Linda
Bought by
Schiele Paul and Schiele Linda K
Current Estimated Value
Home Financials for this Owner
Home Financials are based on the most recent Mortgage that was taken out on this home.
Original Mortgage
$240,500
Outstanding Balance
$214,989
Interest Rate
2.67%
Mortgage Type
New Conventional
Estimated Equity
$570,385
Purchase Details
Closed on
Oct 16, 2019
Sold by
Schiele Paul W and Schiele Linda K
Bought by
Schiele Paul W and Schiele Linda K
Purchase Details
Closed on
Jan 11, 2017
Sold by
Romero Allen Lynn
Bought by
Schiele Paul and Schiele Linda
Home Financials for this Owner
Home Financials are based on the most recent Mortgage that was taken out on this home.
Original Mortgage
$254,000
Interest Rate
4.08%
Mortgage Type
New Conventional
Purchase Details
Closed on
Dec 10, 2004
Sold by
Kirby Rodney C and Kirby Pamela C
Bought by
Romero Allen Lynn
Home Financials for this Owner
Home Financials are based on the most recent Mortgage that was taken out on this home.
Original Mortgage
$220,000
Interest Rate
5.64%
Mortgage Type
Purchase Money Mortgage
Purchase Details
Closed on
Sep 27, 2002
Sold by
Kirby Rodney C and Kirby Pamela C
Bought by
Kirby Rodney C and Kirby Pamela C
Home Financials for this Owner
Home Financials are based on the most recent Mortgage that was taken out on this home.
Original Mortgage
$157,500
Interest Rate
5.65%
Purchase Details
Closed on
Oct 21, 1999
Sold by
Kirby Rodney C and Kirby Pamela C
Bought by
Kirby Rodney C and Kirby Pamela C
Home Financials for this Owner
Home Financials are based on the most recent Mortgage that was taken out on this home.
Original Mortgage
$26,000
Interest Rate
7.86%
Purchase Details
Closed on
Feb 20, 1998
Sold by
Kirby Rodney C and Kirby Pamela C
Bought by
Kirby Rodney C and Kirby Pamela C
Home Financials for this Owner
Home Financials are based on the most recent Mortgage that was taken out on this home.
Original Mortgage
$143,000
Interest Rate
6.46%
Purchase Details
Closed on
Jul 18, 1996
Sold by
Kirby Rodney C and Kirby Pamela C
Bought by
Kirby Rodney C and Kirby Pamela C
Purchase Details
Closed on
Jan 13, 1994
Sold by
Rycor Inc
Bought by
Kirby Rodney C and Kirby Pamela C
Home Financials for this Owner
Home Financials are based on the most recent Mortgage that was taken out on this home.
Original Mortgage
$137,550
Interest Rate
7.29%
Create a Home Valuation Report for This Property
The Home Valuation Report is an in-depth analysis detailing your home's value as well as a comparison with similar homes in the area
Home Values in the Area
Average Home Value in this Area
Purchase History
| Date | Buyer | Sale Price | Title Company |
|---|---|---|---|
| Schiele Paul | -- | Stewart Title Ins Agcy Of Ut | |
| Schiele Paul | -- | Stewart Title Ins Agcy Of Ut | |
| Schiele Paul W | -- | None Available | |
| Schiele Paul | -- | Cottonwood Title | |
| Romero Allen Lynn | -- | Cottonwood Title | |
| Romero Allen Lynn | -- | United Title Services | |
| Kirby Rodney C | -- | Cottonwood Title Ins Agency | |
| Kirby Rodney C | -- | Cottonwood Title Ins Agency | |
| Kirby Rodney C | -- | Backman Stewart Title Servic | |
| Kirby Rodney C | -- | Backman Stewart Title Servic | |
| Kirby Rodney C | -- | -- | |
| Kirby Rodney C | -- | -- | |
| Kirby Rodney C | -- | -- | |
| Kirby Rodney C | -- | -- |
Source: Public Records
Mortgage History
| Date | Status | Borrower | Loan Amount |
|---|---|---|---|
| Open | Schiele Paul | $240,500 | |
| Closed | Schiele Paul | $254,000 | |
| Previous Owner | Romero Allen Lynn | $220,000 | |
| Previous Owner | Kirby Rodney C | $157,500 | |
| Previous Owner | Kirby Rodney C | $26,000 | |
| Previous Owner | Kirby Rodney C | $143,000 | |
| Previous Owner | Kirby Rodney C | $137,550 | |
| Closed | Romero Allen Lynn | $27,400 |
Source: Public Records
Tax History Compared to Growth
Tax History
| Year | Tax Paid | Tax Assessment Tax Assessment Total Assessment is a certain percentage of the fair market value that is determined by local assessors to be the total taxable value of land and additions on the property. | Land | Improvement |
|---|---|---|---|---|
| 2025 | $3,866 | $757,400 | $218,900 | $538,500 |
| 2024 | $3,866 | $734,100 | $211,900 | $522,200 |
| 2023 | $3,950 | $707,600 | $199,900 | $507,700 |
| 2022 | $4,020 | $705,800 | $196,000 | $509,800 |
| 2021 | $3,335 | $537,200 | $131,600 | $405,600 |
| 2020 | $3,065 | $462,900 | $131,600 | $331,300 |
| 2019 | $3,038 | $450,900 | $124,100 | $326,800 |
| 2018 | $2,905 | $429,100 | $124,100 | $305,000 |
| 2017 | $2,699 | $390,700 | $124,100 | $266,600 |
| 2016 | $2,688 | $368,700 | $124,100 | $244,600 |
| 2015 | $2,686 | $358,200 | $158,500 | $199,700 |
| 2014 | $2,580 | $338,100 | $151,100 | $187,000 |
Source: Public Records
Map
Nearby Homes
- 9414 S 1980 W
- 2097 Jordan Villa Dr
- 9496 S 1930 W
- 2116 W Abbey View Rd
- 9252 S 2040 W Unit D
- 1968 W 9270 S Unit C
- 2177 W 9240 S
- 1753 Rylie Ann Cir
- 2223 W Williamsburg Cir
- 9511 S Tirado Cove Unit 204
- Brook Haven Plan at Jordan Woods
- Maple Plan at Jordan Woods
- The Maple Basement Plan at Jordan Woods
- The Evergreen Basement Plan at Jordan Woods
- 9503 S Tirado Cove Unit 203
- 1719 W Brocious Way Unit 301
- 1673 Peaceful Cir
- 2286 Williamsburg Cir
- 1741 W Nikos Ln
- 1788 W Ikaros Ln
- 9421 Spring Willow Cir
- 9417 Spring Willow Cir
- 9417 S Spring Willow Cir
- 9435 Spring Willow Cir
- 9435 S Spring Willow Cir
- 9432 S 1980 W
- 2037 Jordan Villa Dr
- 2037 W Jordan Villa Dr
- 2017 W Jordan Villa Dr
- 2017 Jordan Villa Dr
- 2041 Jordan Villa Dr
- 9422 Spring Willow Cir
- 2013 Jordan Villa Dr
- 9422 S Spring Willow Cir
- 9445 Spring Willow Cir
- 9434 Spring Willow Cir
- 2033 W Jordan Villa Dr
- 2033 Jordan Villa Dr
- 2019 W Jordan Villa Dr
- 2019 Jordan Villa Dr