
Seller's Agent in 2025
Blake Enders
Lyons Share Real Estate
(702) 720-9682
1 in this area
28 Total Sales
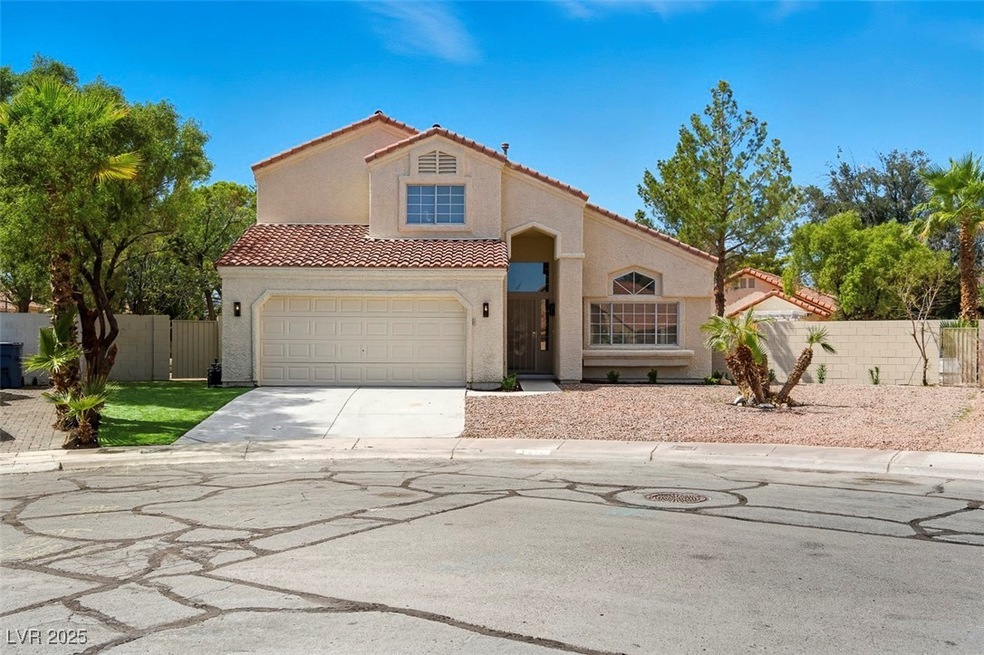
Stunning Newly Remodeled 2-Story Home with Pool & Solar!
Step inside this beautifully updated 2-story residence featuring an open-concept floor plan designed for both comfort and entertaining. The spacious kitchen is the heart of the home, offering modern finishes, ample storage, and room to gather.
The highlight is the downstairs primary suite, complete with a private bath and direct backyard access to your own desert oasis. Enjoy a sparkling heated pool & spa, surrounded by low-maintenance desert landscaping with artificial turf—perfect for year-round relaxation.
Upstairs you’ll find additional bedrooms and flexible living space to suit your needs. Plus, this home comes with the peace of mind of fully paid-off solar, giving you energy savings for years to come. Install date is unknown.
Last Agent to Sell the Property
Lyons Share Real Estate Brokerage Phone: 702-379-0228 License #S.0203116 Listed on: 09/11/2025
| Date | Type | Sale Price | Title Company |
|---|---|---|---|
| Bargain Sale Deed | $650,000 | Equity Title | |
| Bargain Sale Deed | $440,000 | Security 1St Title | |
| Bargain Sale Deed | -- | Security 1St Title | |
| Administrators Deed | -- | None Listed On Document | |
| Deed | -- | North American Title | |
| Bargain Sale Deed | $160,000 | Nevada Title Las Vegas | |
| Interfamily Deed Transfer | -- | Title One | |
| Interfamily Deed Transfer | -- | None Available | |
| Interfamily Deed Transfer | -- | -- | |
| Quit Claim Deed | -- | First American Title Co | |
| Interfamily Deed Transfer | -- | -- | |
| Bargain Sale Deed | $224,900 | Fidelity National Title Agen |
| Date | Status | Loan Amount | Loan Type |
|---|---|---|---|
| Previous Owner | $475,600 | Construction | |
| Previous Owner | $155,944 | FHA | |
| Previous Owner | $280,000 | No Value Available | |
| Previous Owner | $185,600 | No Value Available | |
| Previous Owner | $202,400 | No Value Available | |
| Closed | $20,650 | No Value Available |
| Date | Event | Price | List to Sale | Price per Sq Ft |
|---|---|---|---|---|
| 09/29/2025 09/29/25 | Sold | $650,000 | -1.5% | $296 / Sq Ft |
| 09/18/2025 09/18/25 | Pending | -- | -- | -- |
| 09/11/2025 09/11/25 | For Sale | $659,999 | -- | $301 / Sq Ft |
| Year | Tax Paid | Tax Assessment Tax Assessment Total Assessment is a certain percentage of the fair market value that is determined by local assessors to be the total taxable value of land and additions on the property. | Land | Improvement |
|---|---|---|---|---|
| 2026 | $3,206 | $119,113 | $46,970 | $72,143 |
| 2025 | $2,969 | $122,730 | $48,125 | $74,605 |
| 2024 | $2,883 | $122,730 | $48,125 | $74,605 |
| 2023 | $2,883 | $110,720 | $39,270 | $71,450 |
| 2022 | $2,935 | $101,916 | $35,805 | $66,111 |
| 2021 | $2,718 | $93,874 | $30,800 | $63,074 |
| 2020 | $2,520 | $91,394 | $28,490 | $62,904 |
| 2019 | $2,362 | $88,192 | $25,795 | $62,397 |
| 2018 | $2,254 | $84,787 | $24,255 | $60,532 |
| 2017 | $2,825 | $86,174 | $24,255 | $61,919 |
| 2016 | $2,110 | $79,558 | $17,325 | $62,233 |
| 2015 | $2,106 | $65,405 | $12,705 | $52,700 |
| 2014 | $2,040 | $60,374 | $9,625 | $50,749 |
Seller's Agent in 2025
Blake Enders
Lyons Share Real Estate
(702) 720-9682
1 in this area
28 Total Sales
Buyer's Agent in 2025
Angel Flores
Blue Diamond Realty LLC
(702) 419-9184
1 in this area
198 Total Sales
Source: Las Vegas REALTORS®
MLS Number: 2718265
APN: 163-07-813-006
Disclaimer: Certain information contained herein is derived from information provided by parties other than Homes.com. All information provided is deemed reliable, but is not guaranteed to be accurate and should be independently verified.
![]() The data relating to real estate for sale on this web site comes in part from the INTERNET DATA EXCHANGE Program of the Greater Las Vegas Association of REALTORS® MLS. Real estate listings held by brokerage firms other than this site owner are marked with the IDX logo. Information is deemed reliable but not guaranteed. Copyright 2026 of the Greater Las Vegas Association of REALTORS® MLS. All rights reserved.
The data relating to real estate for sale on this web site comes in part from the INTERNET DATA EXCHANGE Program of the Greater Las Vegas Association of REALTORS® MLS. Real estate listings held by brokerage firms other than this site owner are marked with the IDX logo. Information is deemed reliable but not guaranteed. Copyright 2026 of the Greater Las Vegas Association of REALTORS® MLS. All rights reserved.
Ask me questions while you tour the home.