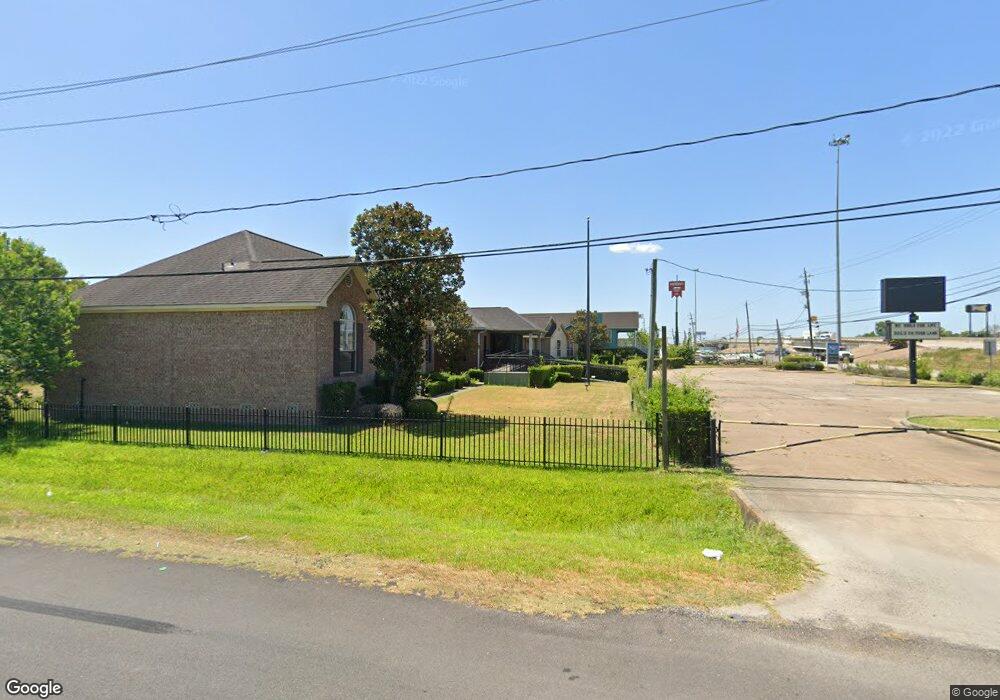
9422 North Fwy Houston, TX 77037
Estimated Value: $714,573
--
Bed
--
Bath
28,240
Sq Ft
$25/Sq Ft
Est. Value
About This Home
This home is located at 9422 North Fwy, Houston, TX 77037 and is currently priced at $714,573, approximately $25 per square foot. 9422 North Fwy is a home located in Harris County with nearby schools including Jerry Keeble Ec/Pre-K, Goodman Elementary School, and Aldine Ninth Grade School.
Ownership History
Date
Name
Owned For
Owner Type
Purchase Details
Closed on
Aug 23, 2022
Sold by
United Built Homes Llc
Bought by
45N Kana Hospitality Inc
Current Estimated Value
Purchase Details
Closed on
Jun 6, 2008
Sold by
Burns Arthur C and Burns Linda M
Bought by
Burns Felicia
Purchase Details
Closed on
Jun 25, 2007
Sold by
Williams Amiagh
Bought by
Smith Genevieve
Purchase Details
Closed on
Feb 24, 2007
Sold by
Anderson Billie and Nicholson Jerrie
Bought by
Weatherford Terry
Purchase Details
Closed on
Jul 26, 2005
Sold by
Fields Roger L
Bought by
Fields Gerald L
Purchase Details
Closed on
May 3, 2004
Sold by
Jackson Bruce and Jackson Glinda
Bought by
Thibodeaux Derek N and Thibodeaux Christen
Purchase Details
Closed on
Jul 5, 2003
Sold by
Wright Damon Bret
Bought by
Adams Denise W
Create a Home Valuation Report for This Property
The Home Valuation Report is an in-depth analysis detailing your home's value as well as a comparison with similar homes in the area
Home Values in the Area
Average Home Value in this Area
Purchase History
| Date | Buyer | Sale Price | Title Company |
|---|---|---|---|
| 45N Kana Hospitality Inc | -- | None Listed On Document | |
| Burns Felicia | -- | None Available | |
| Bugbee William C | -- | None Available | |
| Smith Genevieve | -- | None Available | |
| Weatherford Terry | -- | None Available | |
| Fields Gerald L | -- | -- | |
| Thibodeaux Derek N | -- | -- | |
| Adams Denise W | -- | -- |
Source: Public Records
Tax History Compared to Growth
Tax History
| Year | Tax Paid | Tax Assessment Tax Assessment Total Assessment is a certain percentage of the fair market value that is determined by local assessors to be the total taxable value of land and additions on the property. | Land | Improvement |
|---|---|---|---|---|
| 2025 | $42,582 | $4,223,857 | $384,140 | $3,839,717 |
| 2024 | $42,582 | $1,876,304 | $384,140 | $1,492,164 |
| 2023 | $42,582 | $1,028,092 | $456,080 | $572,012 |
| 2022 | $26,292 | $1,096,137 | $456,080 | $640,057 |
| 2021 | $22,686 | $903,149 | $456,080 | $447,069 |
| 2020 | $22,960 | $869,843 | $456,080 | $413,763 |
| 2019 | $24,854 | $898,161 | $456,080 | $442,081 |
| 2018 | $11,719 | $816,154 | $410,472 | $405,682 |
| 2017 | $21,523 | $811,320 | $410,472 | $400,848 |
| 2016 | $21,689 | $817,585 | $410,472 | $407,113 |
| 2015 | $20,648 | $777,872 | $364,864 | $413,008 |
| 2014 | $20,648 | $775,944 | $364,864 | $411,080 |
Source: Public Records
Map
Nearby Homes
- 9621 Sweetwater Ln
- 907 Twin Falls Rd
- 619 Rocky Mountain Dr
- 1011 Beaver Bend Rd
- 619 Rainy River Dr
- 1102 Mosher Ln
- 1119 Twin Falls Rd
- 9022 Indian River Dr
- 9018 Lazy River Ln
- 113 Busch St Unit 5
- 9207 Cobbleshire Dr
- 9006 Winding River Dr
- 9231 Rockcliff Dr
- 216 Hawkins Ave
- 230 Busch St
- 1326 Twin Falls Rd
- 1330 Mosher Ln
- 132 Hambrick Rd
- 321 E Lorino St
- 502 Hawkins Ave