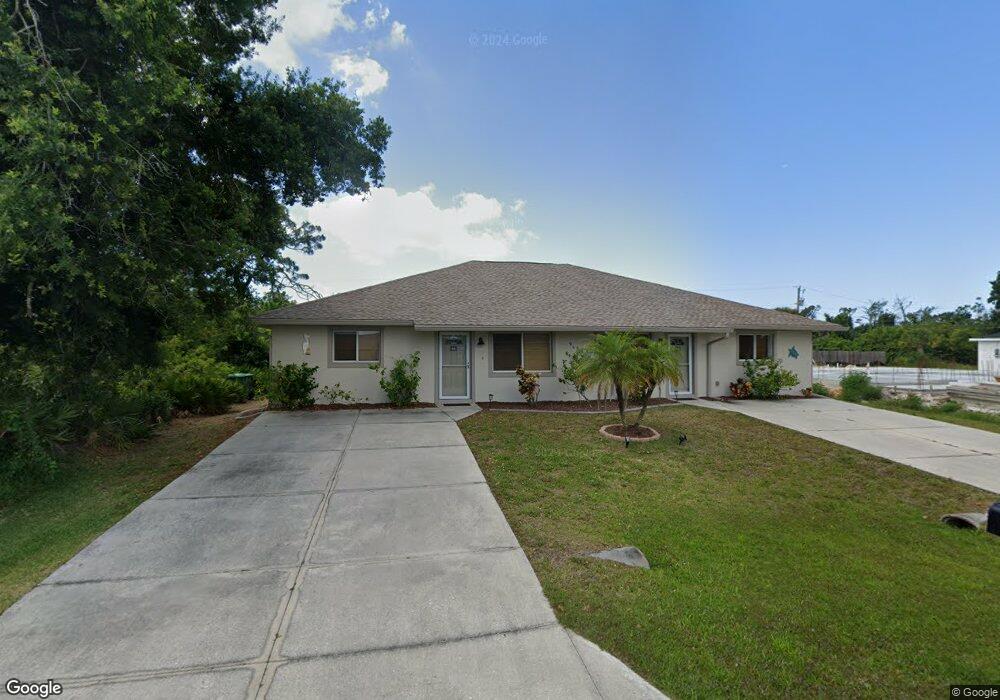
9423 Acco Ave Unit A Englewood, FL 34224
Englewood East NeighborhoodEstimated Value: $145,000 - $199,000
2
Beds
2
Baths
1,086
Sq Ft
$162/Sq Ft
Est. Value
About This Home
This home is located at 9423 Acco Ave Unit A, Englewood, FL 34224 and is currently estimated at $175,576, approximately $161 per square foot. 9423 Acco Ave Unit A is a home located in Charlotte County with nearby schools including Vineland Elementary School, L.A. Ainger Middle School, and Lemon Bay High School.
Ownership History
Date
Name
Owned For
Owner Type
Purchase Details
Closed on
Nov 23, 2009
Sold by
Miller Albert James and Miller Rosemary Janice
Bought by
Schneider Kari and Schneider Jeannette
Current Estimated Value
Home Financials for this Owner
Home Financials are based on the most recent Mortgage that was taken out on this home.
Original Mortgage
$52,000
Interest Rate
6%
Mortgage Type
Balloon
Purchase Details
Closed on
Jan 29, 2008
Sold by
Boca Beach Capital Llc
Bought by
Miller Albert James and Miller Rosemary Janice
Purchase Details
Closed on
Mar 12, 2007
Sold by
Schott Aubrey and Schott Susan
Bought by
The 9423 Land Trust and Boca Beach Capital Llc
Home Financials for this Owner
Home Financials are based on the most recent Mortgage that was taken out on this home.
Original Mortgage
$127,698
Interest Rate
6.3%
Mortgage Type
Purchase Money Mortgage
Purchase Details
Closed on
Jun 5, 2006
Sold by
Developers Of Beechwood Villas Llc
Bought by
Schott Aubrey and Schott Susan
Create a Home Valuation Report for This Property
The Home Valuation Report is an in-depth analysis detailing your home's value as well as a comparison with similar homes in the area
Home Values in the Area
Average Home Value in this Area
Purchase History
| Date | Buyer | Sale Price | Title Company |
|---|---|---|---|
| Schneider Kari | $62,000 | Chelsea Title Company | |
| Miller Albert James | -- | None Available | |
| The 9423 Land Trust | $124,900 | Exceptional Title & Escrow S | |
| Schott Aubrey | $180,000 | Attorney |
Source: Public Records
Mortgage History
| Date | Status | Borrower | Loan Amount |
|---|---|---|---|
| Closed | Schneider Kari | $52,000 | |
| Previous Owner | The 9423 Land Trust | $127,698 |
Source: Public Records
Tax History Compared to Growth
Tax History
| Year | Tax Paid | Tax Assessment Tax Assessment Total Assessment is a certain percentage of the fair market value that is determined by local assessors to be the total taxable value of land and additions on the property. | Land | Improvement |
|---|---|---|---|---|
| 2023 | $943 | $11,901 | $0 | $0 |
| 2022 | $2,607 | $132,864 | $0 | $132,864 |
| 2021 | $2,327 | $98,354 | $0 | $98,354 |
| 2020 | $2,179 | $94,903 | $0 | $94,903 |
| 2019 | $2,243 | $105,256 | $0 | $105,256 |
| 2018 | $1,957 | $103,530 | $0 | $103,530 |
| 2017 | $1,788 | $87,138 | $0 | $0 |
| 2016 | $1,696 | $74,025 | $0 | $0 |
| 2015 | $1,523 | $67,295 | $0 | $0 |
| 2014 | $1,434 | $62,135 | $0 | $0 |
Source: Public Records
Map
Nearby Homes
- 3441 S Access Rd
- 6508 Amory St
- 6454 Whelan St
- 9491 Tacoma Ave
- 6390 Spinnaker Blvd
- 6349 Spinnaker Blvd
- 6373 Spinnaker Blvd
- 6487 Mechler St
- 6495 Mechler St
- 7066 Bargello St
- 7030 Spinnaker Blvd
- 7007 Beardsley St
- 9269 Boca Grande Ave
- 6382 Spinnaker Blvd
- 3285 S Access Rd
- 6312 Brookridge St
- 6360 Brookridge St
- 6264 Brookridge St
- 6368 Brookridge St
- 6269 Blackberry St
- 9423 Acco Ave Unit B
- 9417 Acco Ave
- 9415 Acco Ave
- 9431 Acco Ave
- 9399 Acco Ave Unit B
- 6936 Adderly Rd
- 9407 Acco Ave Unit 9409
- 9407 Acco Ave
- 9406 Acco Ave
- 9398 Acco Ave
- 9422 Acco Ave Unit A AND B
- 9422 Acco Ave
- 9439 Acco Ave
- 9439 Acco Ave Unit B
- 9439 Acco Ave Unit A
- 9430 Acco Ave
- 6928 Adderly Rd
- 6952 Adderly Rd
- 9438 Acco Ave
- 9397 Acco Ave Unit B