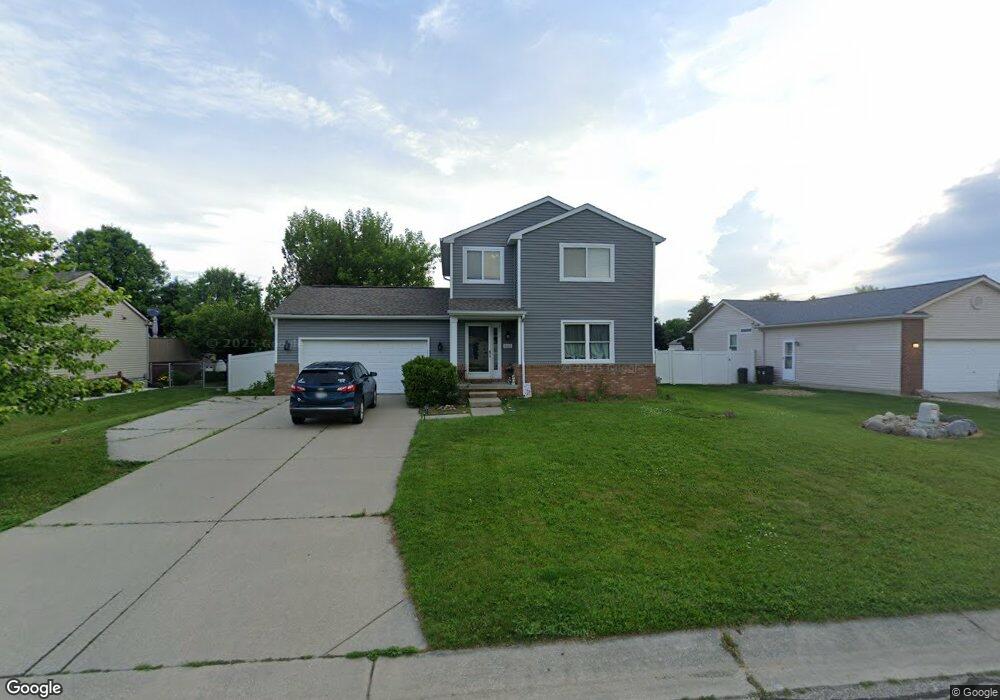
9423 Sandy Hollow Ln Unit Bldg-Unit Davison, MI 48423
Estimated Value: $255,000 - $262,000
--
Bed
3
Baths
1,384
Sq Ft
$187/Sq Ft
Est. Value
About This Home
This home is located at 9423 Sandy Hollow Ln Unit Bldg-Unit, Davison, MI 48423 and is currently estimated at $258,140, approximately $186 per square foot. 9423 Sandy Hollow Ln Unit Bldg-Unit is a home located in Genesee County with nearby schools including Thomson Elementary School, Siple Elementary School, and Hill Elementary School.
Ownership History
Date
Name
Owned For
Owner Type
Purchase Details
Closed on
May 10, 2018
Sold by
Mortiz David S and Mortiz Daniel A
Bought by
Hoffmqan Matthew and Hoffman Rachel
Current Estimated Value
Home Financials for this Owner
Home Financials are based on the most recent Mortgage that was taken out on this home.
Original Mortgage
$137,362
Outstanding Balance
$118,191
Interest Rate
4.37%
Mortgage Type
FHA
Estimated Equity
$139,949
Purchase Details
Closed on
Dec 30, 2005
Sold by
Poropat Douglas and Poropat Jenelle D
Bought by
Moritz David S and Moritz Daniela A
Purchase Details
Closed on
Jan 15, 2003
Sold by
Locke Mary and Locke Guy
Bought by
Poropat Douglas F and Hupfer Jenelle D
Create a Home Valuation Report for This Property
The Home Valuation Report is an in-depth analysis detailing your home's value as well as a comparison with similar homes in the area
Home Values in the Area
Average Home Value in this Area
Purchase History
| Date | Buyer | Sale Price | Title Company |
|---|---|---|---|
| Hoffmqan Matthew | $150,000 | Gorrow Title Agency Llc | |
| Moritz David S | $160,680 | Lawyers Title Insurance Corp | |
| Poropat Douglas F | $30,000 | Lawyers Title Insurance Corp |
Source: Public Records
Mortgage History
| Date | Status | Borrower | Loan Amount |
|---|---|---|---|
| Open | Hoffmqan Matthew | $137,362 |
Source: Public Records
Tax History Compared to Growth
Tax History
| Year | Tax Paid | Tax Assessment Tax Assessment Total Assessment is a certain percentage of the fair market value that is determined by local assessors to be the total taxable value of land and additions on the property. | Land | Improvement |
|---|---|---|---|---|
| 2025 | $3,421 | $120,600 | $0 | $0 |
| 2024 | $1,012 | $111,100 | $0 | $0 |
| 2023 | $966 | $107,600 | $0 | $0 |
| 2022 | $3,015 | $86,500 | $0 | $0 |
| 2021 | $2,988 | $79,100 | $0 | $0 |
| 2020 | $883 | $76,300 | $0 | $0 |
| 2019 | $873 | $75,200 | $0 | $0 |
| 2018 | $1,325 | $65,500 | $0 | $0 |
| 2017 | $3,626 | $65,500 | $0 | $0 |
| 2016 | $3,372 | $62,000 | $0 | $0 |
| 2015 | $2,175 | $58,200 | $0 | $0 |
| 2014 | $508 | $53,600 | $0 | $0 |
| 2012 | -- | $42,400 | $42,400 | $0 |
Source: Public Records
Map
Nearby Homes
- 9475 Sandy Hollow Ln Unit 109
- 5238 N Gale Rd
- 9508 Orchard Lake Dr
- 9520 Orchard Lake Dr
- 255 Roosevelt Dr
- 6096 N Gale Rd
- 6152 N Gale Rd
- 5346 N Oak Rd
- 4078 N State Rd
- 9805 E Richfield Rd
- 4438 N Oak Rd
- 9377 Hubbard Rd
- 4063 N Gale Rd
- 9413 Blue Spruce Ct Unit 54
- 3372 Spruceridge Ct Unit 82
- 3365 Spruceridge Ct Unit 78
- 3369 Meadow Ridge Ct
- 3367 Meadow Ridge Ct
- 9100 Dublin Way
- 1240 N Irish Rd
- 9423 Sandy Hollow Ln Unit 104
- 9415 Sandy Hollow Ln Unit 103
- 9431 Sandy Hollow Ln Unit 105
- 9407 Sandy Hollow Ln Unit 102
- 9422 Tiger Run Trail Unit 71
- 9439 Sandy Hollow Ln Unit 106
- 9414 Tiger Run Trail Unit 72
- 9406 Tiger Run Trail Unit 73
- 9424 Sandy Hollow Ln Unit 53
- 9438 Tiger Run Trail Unit 69
- 9432 Sandy Hollow Ln Unit 54
- 9416 Sandy Hollow Ln Unit 52
- 9399 Sandy Hollow Ln Unit 101
- 9447 Sandy Hollow Ln Unit 107
- 9440 Sandy Hollow Ln Unit 55
- 9408 Sandy Hollow Ln Unit 51
- 9398 Tiger Run Trail
- 9391 Sandy Hollow Ln Unit 100
- 9455 Sandy Hollow Ln Unit 108
- 9383 Sandy Hollow Ln Unit 99