Estimated Value: $601,000 - $686,000
3
Beds
4
Baths
1,664
Sq Ft
$386/Sq Ft
Est. Value
About This Home
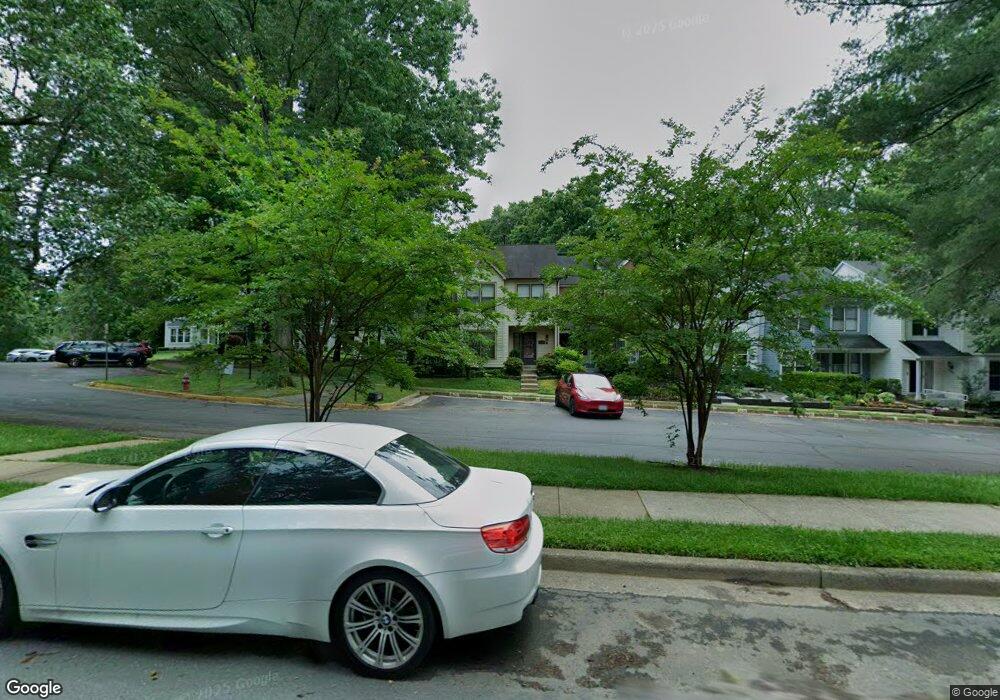
This home is located at 9425 Ulysses Ct, Burke, VA 22015 and is currently estimated at $641,830, approximately $385 per square foot. 9425 Ulysses Ct is a home located in Fairfax County with nearby schools including Kings Park Elementary School, Kings Glen Elementary School, and Lake Braddock Secondary School.
Ownership History
Date
Name
Owned For
Owner Type
Purchase Details
Closed on
Sep 22, 2020
Sold by
Arnold Hollie F and Arnold Scott M
Bought by
Arnold Hollie F
Current Estimated Value
Home Financials for this Owner
Home Financials are based on the most recent Mortgage that was taken out on this home.
Original Mortgage
$400,000
Outstanding Balance
$354,974
Interest Rate
2.9%
Mortgage Type
New Conventional
Estimated Equity
$286,856
Purchase Details
Closed on
Feb 6, 2003
Sold by
Dearth Samuel
Bought by
Arnold Scott
Home Financials for this Owner
Home Financials are based on the most recent Mortgage that was taken out on this home.
Original Mortgage
$309,000
Interest Rate
5.99%
Mortgage Type
New Conventional
Purchase Details
Closed on
Mar 12, 1999
Sold by
Martin Barbara I
Bought by
Dearth Samuel
Home Financials for this Owner
Home Financials are based on the most recent Mortgage that was taken out on this home.
Original Mortgage
$183,350
Interest Rate
6.73%
Create a Home Valuation Report for This Property
The Home Valuation Report is an in-depth analysis detailing your home's value as well as a comparison with similar homes in the area
Home Values in the Area
Average Home Value in this Area
Purchase History
| Date | Buyer | Sale Price | Title Company |
|---|---|---|---|
| Arnold Hollie F | -- | Priority Title And Escrow | |
| Arnold Scott | $309,000 | -- | |
| Dearth Samuel | $193,000 | -- |
Source: Public Records
Mortgage History
| Date | Status | Borrower | Loan Amount |
|---|---|---|---|
| Open | Arnold Hollie F | $400,000 | |
| Previous Owner | Arnold Scott | $309,000 | |
| Previous Owner | Dearth Samuel | $183,350 |
Source: Public Records
Tax History Compared to Growth
Tax History
| Year | Tax Paid | Tax Assessment Tax Assessment Total Assessment is a certain percentage of the fair market value that is determined by local assessors to be the total taxable value of land and additions on the property. | Land | Improvement |
|---|---|---|---|---|
| 2025 | $6,595 | $535,300 | $160,000 | $375,300 |
| 2024 | $6,595 | $569,290 | $160,000 | $409,290 |
| 2023 | $5,938 | $526,210 | $145,000 | $381,210 |
| 2022 | $5,772 | $504,750 | $145,000 | $359,750 |
| 2021 | $5,629 | $479,690 | $135,000 | $344,690 |
| 2020 | $5,668 | $478,890 | $135,000 | $343,890 |
| 2019 | $5,463 | $461,570 | $120,000 | $341,570 |
| 2018 | $5,136 | $446,590 | $120,000 | $326,590 |
| 2017 | $4,883 | $420,550 | $115,000 | $305,550 |
| 2016 | $4,653 | $401,650 | $105,000 | $296,650 |
| 2015 | $4,381 | $392,550 | $105,000 | $287,550 |
| 2014 | $4,104 | $368,560 | $105,000 | $263,560 |
Source: Public Records
Map
Nearby Homes
- 9513 Burdett Rd
- 9438 Wallingford Dr
- 5432 Brixham Ct
- 5502 Saddlebrook Ct
- 9710 Ashbourn Dr
- 9662 Westport Ln
- 5658 Sutherland Ct
- 5711 Crownleigh Ct
- 9769 High Water Ct
- 5055 Kenerson Dr
- 5714 Mason Bluff Dr
- 5608 Doolittle St
- 5307 Richardson Dr
- 5039 Kenerson Dr
- 5137 Richardson Dr
- 9104 Parliament Dr
- 9717 Commonwealth Blvd
- 9909 Lakepointe Dr
- 9316 Lee St
- 9370 Colbert Ct
- 9427 Ulysses Ct
- 9429 Ulysses Ct
- 9431 Ulysses Ct
- 9433 Ulysses Ct
- 9423 Ulysses Ct
- 9421 Ulysses Ct
- 9419 Ulysses Ct
- 9417 Ulysses Ct
- 9415 Ulysses Ct
- 9413 Ulysses Ct
- 9411 Ulysses Ct
- 5420 Lighthouse Ln
- 5416 Lighthouse Ln
- 5414 Lighthouse Ln
- 5412 Lighthouse Ln
- 5422 Lighthouse Ln
- 9409 Ulysses Ct
- 9400 Ulysses Ct
- 5410 Lighthouse Ln
- 9406 Ulysses Ct