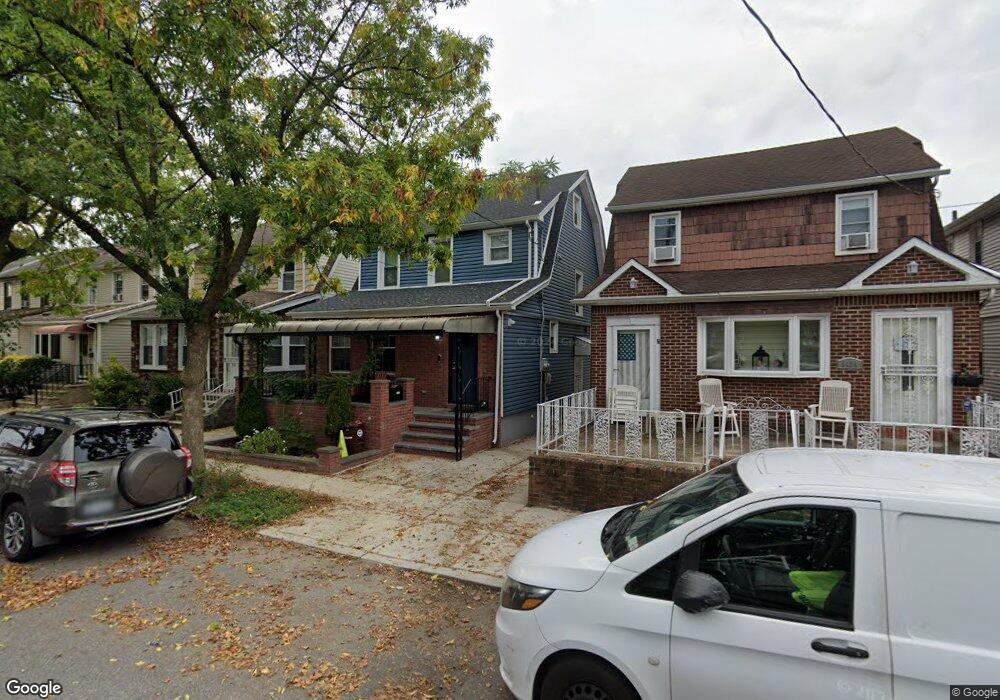
9426 109th Ave Ozone Park, NY 11417
Ozone Park NeighborhoodEstimated Value: $767,856 - $875,000
5
Beds
2
Baths
1,298
Sq Ft
$648/Sq Ft
Est. Value
About This Home
This home is located at 9426 109th Ave, Ozone Park, NY 11417 and is currently estimated at $840,464, approximately $647 per square foot. 9426 109th Ave is a home located in Queens County with nearby schools including P.S. 63 - Old South, Robert H. Goddard High School, and John Adams High School.
Ownership History
Date
Name
Owned For
Owner Type
Purchase Details
Closed on
Jul 16, 2018
Sold by
Wong Jose Elias
Bought by
Bosco Daniel
Current Estimated Value
Home Financials for this Owner
Home Financials are based on the most recent Mortgage that was taken out on this home.
Original Mortgage
$677,502
Outstanding Balance
$589,527
Interest Rate
4.87%
Mortgage Type
FHA
Estimated Equity
$250,937
Purchase Details
Closed on
Apr 20, 2007
Sold by
Suero Sulky
Bought by
Wong Jose Elias
Home Financials for this Owner
Home Financials are based on the most recent Mortgage that was taken out on this home.
Original Mortgage
$125,080
Interest Rate
6.23%
Purchase Details
Closed on
Aug 12, 2004
Sold by
Gugliemo Patricia and Gugliemo Victor D
Bought by
Suero Sulky
Home Financials for this Owner
Home Financials are based on the most recent Mortgage that was taken out on this home.
Original Mortgage
$352,000
Interest Rate
6.02%
Mortgage Type
Purchase Money Mortgage
Create a Home Valuation Report for This Property
The Home Valuation Report is an in-depth analysis detailing your home's value as well as a comparison with similar homes in the area
Home Values in the Area
Average Home Value in this Area
Purchase History
| Date | Buyer | Sale Price | Title Company |
|---|---|---|---|
| Bosco Daniel | $690,000 | -- | |
| Bosco Daniel | $690,000 | -- | |
| Wong Jose Elias | $625,400 | -- | |
| Wong Jose Elias | $625,400 | -- | |
| Suero Sulky | $440,000 | -- | |
| Suero Sulky | $440,000 | -- |
Source: Public Records
Mortgage History
| Date | Status | Borrower | Loan Amount |
|---|---|---|---|
| Open | Bosco Daniel | $677,502 | |
| Closed | Bosco Daniel | $677,502 | |
| Previous Owner | Wong Jose Elias | $125,080 | |
| Previous Owner | Wong Jose Elias | $500,320 | |
| Previous Owner | Suero Sulky | $66,000 | |
| Previous Owner | Suero Sulky | $352,000 |
Source: Public Records
Tax History Compared to Growth
Tax History
| Year | Tax Paid | Tax Assessment Tax Assessment Total Assessment is a certain percentage of the fair market value that is determined by local assessors to be the total taxable value of land and additions on the property. | Land | Improvement |
|---|---|---|---|---|
| 2025 | $6,956 | $36,712 | $11,311 | $25,401 |
| 2024 | $6,956 | $34,634 | $11,693 | $22,941 |
| 2023 | $6,956 | $34,634 | $11,105 | $23,529 |
| 2022 | $6,755 | $38,340 | $14,160 | $24,180 |
| 2021 | $6,825 | $36,060 | $14,160 | $21,900 |
| 2020 | $6,476 | $36,960 | $14,160 | $22,800 |
| 2019 | $6,038 | $40,740 | $14,160 | $26,580 |
| 2018 | $5,884 | $28,862 | $13,382 | $15,480 |
| 2017 | $5,749 | $28,200 | $12,848 | $15,352 |
| 2016 | $5,402 | $28,200 | $12,848 | $15,352 |
| 2015 | $3,209 | $25,495 | $13,413 | $12,082 |
| 2014 | $3,209 | $24,052 | $14,129 | $9,923 |
Source: Public Records
Map
Nearby Homes
- 9426 Sutter Ave
- 107-62 93rd St
- 9108 Sutter Ave
- 10723 96th St
- 107-20 92nd St
- 10719 96th St
- 9439 134th Ave
- 13319 Crossbay Blvd
- 106-38 95th St
- 91-25 Gold Rd
- 13408 Sitka St
- 107-50 90th St
- 96-06 134th Rd
- 10751 89th St
- 84-07 Sutter Ave
- 92-18 Liberty Ave
- 132-18 89th St
- 95-18 Linden Blvd
- 92-17 Liberty Ave
- 8851 Pitkin Ave
- 9426 109th Ave
- 9426 109th Ave
- 9430 109th Ave
- 9424 109th Ave
- 94-30 109th Ave
- 94-30 109th Ave Unit 2
- 9432 109th Ave
- 9420 109th Ave
- 9436 109th Ave
- 9418 109th Ave
- 9438 109th Ave
- 9427 Sutter Ave
- 9414 109th Ave
- 9431 Sutter Ave
- 9423 Sutter Ave
- 94-18 109th Ave
- 9429 109th Ave
- 9435 Sutter Ave
- 9419 Sutter Ave
- 9419 109th Ave