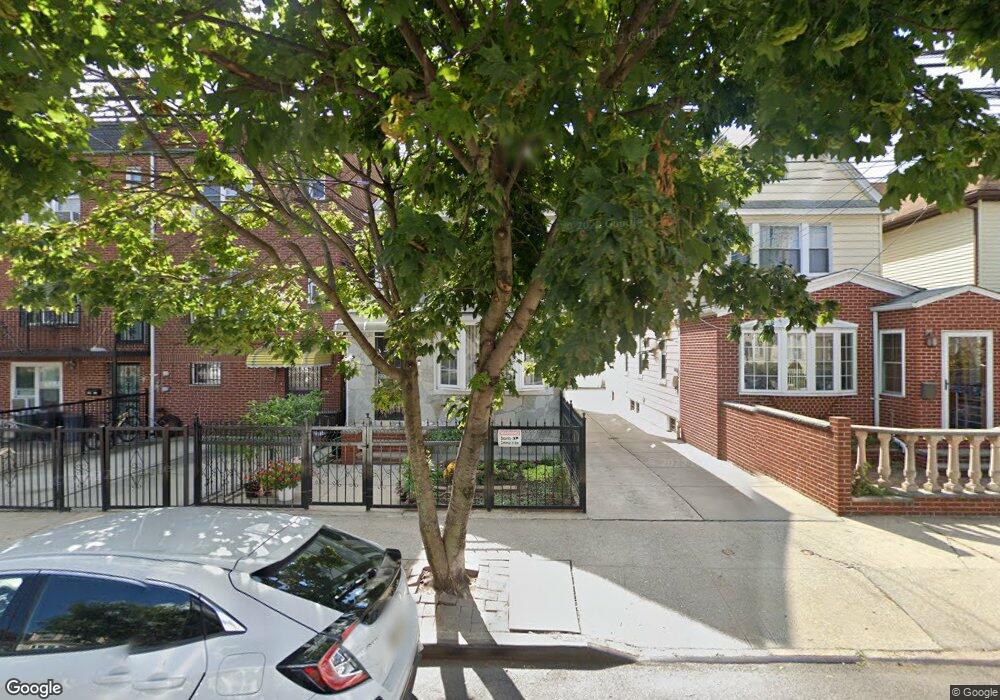
9426 52nd Ave Elmhurst, NY 11373
Elmhurst NeighborhoodEstimated Value: $926,000 - $1,108,000
--
Bed
--
Bath
1,712
Sq Ft
$586/Sq Ft
Est. Value
About This Home
This home is located at 9426 52nd Ave, Elmhurst, NY 11373 and is currently estimated at $1,003,736, approximately $586 per square foot. 9426 52nd Ave is a home located in Queens County with nearby schools including P.S. 13 Clement C Moore, I.S. 093 Ridgewood, and Joseph F. Quinn Intermediate School 77.
Ownership History
Date
Name
Owned For
Owner Type
Purchase Details
Closed on
May 3, 2010
Sold by
Sakellaridis Gemma and Sakellaridis Steve
Bought by
Li Yan Yan and Mei Jing Xing
Current Estimated Value
Home Financials for this Owner
Home Financials are based on the most recent Mortgage that was taken out on this home.
Original Mortgage
$100,000
Outstanding Balance
$66,707
Interest Rate
5.11%
Mortgage Type
Purchase Money Mortgage
Estimated Equity
$937,029
Purchase Details
Closed on
Aug 25, 2006
Sold by
Barril Allan and Barril Grace
Bought by
Sakellaridis Gemma and Sakellaridis Steve
Home Financials for this Owner
Home Financials are based on the most recent Mortgage that was taken out on this home.
Original Mortgage
$500,000
Interest Rate
6.79%
Mortgage Type
Purchase Money Mortgage
Purchase Details
Closed on
Aug 11, 1997
Sold by
Valcos Roehl and Valcos Sonia
Bought by
Barril Allan and Barril Grace W
Home Financials for this Owner
Home Financials are based on the most recent Mortgage that was taken out on this home.
Original Mortgage
$196,650
Interest Rate
7.47%
Create a Home Valuation Report for This Property
The Home Valuation Report is an in-depth analysis detailing your home's value as well as a comparison with similar homes in the area
Home Values in the Area
Average Home Value in this Area
Purchase History
| Date | Buyer | Sale Price | Title Company |
|---|---|---|---|
| Li Yan Yan | $580,000 | -- | |
| Li Yan Yan | $580,000 | -- | |
| Sakellaridis Gemma | $625,000 | -- | |
| Sakellaridis Gemma | $625,000 | -- | |
| Barril Allan | $207,000 | -- | |
| Barril Allan | $207,000 | -- |
Source: Public Records
Mortgage History
| Date | Status | Borrower | Loan Amount |
|---|---|---|---|
| Open | Li Yan Yan | $100,000 | |
| Closed | Li Yan Yan | $100,000 | |
| Previous Owner | Sakellaridis Gemma | $500,000 | |
| Previous Owner | Barril Allan | $196,650 |
Source: Public Records
Tax History Compared to Growth
Tax History
| Year | Tax Paid | Tax Assessment Tax Assessment Total Assessment is a certain percentage of the fair market value that is determined by local assessors to be the total taxable value of land and additions on the property. | Land | Improvement |
|---|---|---|---|---|
| 2025 | $6,454 | $35,506 | $10,764 | $24,742 |
| 2024 | $6,466 | $33,534 | $10,166 | $23,368 |
| 2023 | $6,109 | $31,814 | $8,188 | $23,626 |
| 2022 | $5,816 | $55,920 | $17,280 | $38,640 |
| 2021 | $6,038 | $54,900 | $17,280 | $37,620 |
| 2020 | $5,967 | $49,920 | $17,280 | $32,640 |
| 2019 | $5,553 | $48,360 | $17,280 | $31,080 |
| 2018 | $5,107 | $26,512 | $8,930 | $17,582 |
| 2017 | $4,813 | $25,081 | $9,393 | $15,688 |
| 2016 | $4,704 | $25,081 | $9,393 | $15,688 |
| 2015 | $2,854 | $24,657 | $11,689 | $12,968 |
| 2014 | $2,854 | $23,288 | $12,760 | $10,528 |
Source: Public Records
Map
Nearby Homes
- 9414 51st Ave
- 51-02 Junction Blvd
- 94-30 50th Ave
- 94-28 53rd Ave
- 93-10 50th Ave
- 94-14 Corona Ave
- 9628 Corona Ave
- 5214 92nd St
- 53-37 97th St
- 9052 52nd Ave
- 9421 Alstyne Ave Unit 2D
- 54-08 92nd St
- 97-07 55th Ave
- 4808 92nd St
- 96-15 Alstyne Ave
- 92-30 56th Ave Unit 5F
- 92-30 56th Ave Unit 5N
- 92-30 56th Ave Unit 6M
- 91-02 50th Ave
- 97-40 Corona Ave
- 9428 52nd Ave
- 9424 52nd Ave
- 9430 52nd Ave
- 9430 52nd Ave
- 94-22 52nd Ave
- 9422 52nd Ave
- 9432 52nd Ave
- 9420 52nd Ave
- 94-16 52nd Ave
- 9416 52nd Ave
- 9423 53rd Ave
- 9425 53rd Ave
- 9423 53rd Ave
- 5206 Junction Blvd
- 9421 53rd Ave
- 5204 Junction Blvd
- 5208 Junction Blvd
- 9427 53rd Ave
- 5202 Junction Blvd
- 5210 Junction Blvd