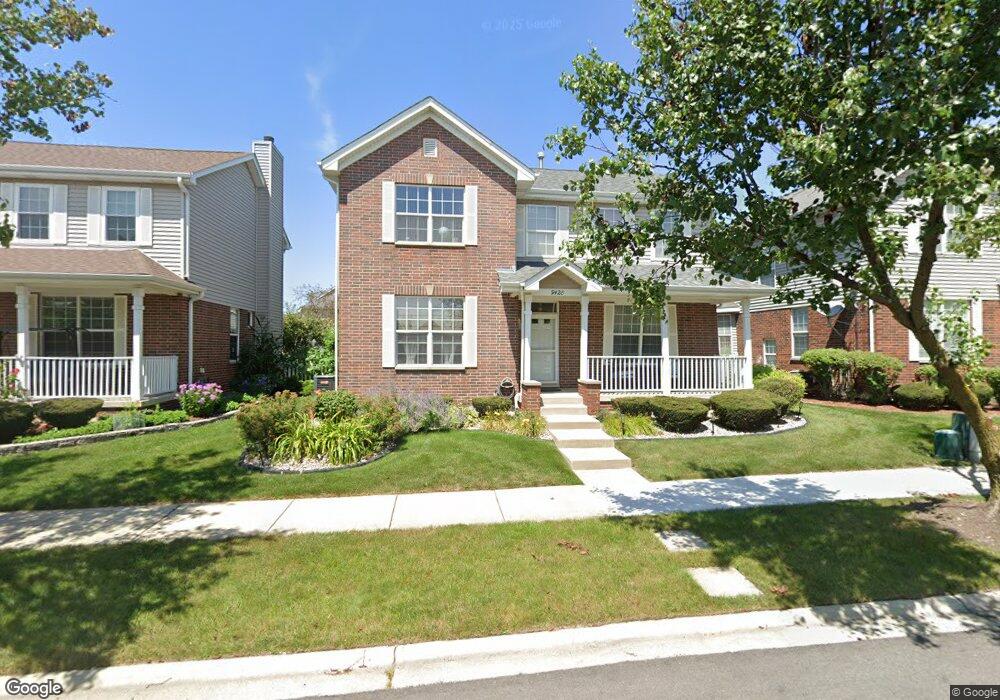
9428 Providence Square Orland Park, IL 60467
Central Orland NeighborhoodEstimated Value: $492,353 - $537,000
4
Beds
3
Baths
2,618
Sq Ft
$196/Sq Ft
Est. Value
About This Home
This home is located at 9428 Providence Square, Orland Park, IL 60467 and is currently estimated at $513,588, approximately $196 per square foot. 9428 Providence Square is a home located in Cook County with nearby schools including Orland Center School, Meadow Ridge School, and Century Junior High School.
Ownership History
Date
Name
Owned For
Owner Type
Purchase Details
Closed on
Jan 16, 2008
Sold by
Kantsedal Vladimir and Kantsedal Evgenia
Bought by
Kantsedal Vladimir and Kantsedal Evguenia
Current Estimated Value
Home Financials for this Owner
Home Financials are based on the most recent Mortgage that was taken out on this home.
Original Mortgage
$234,000
Outstanding Balance
$148,167
Interest Rate
6.22%
Mortgage Type
New Conventional
Estimated Equity
$365,421
Purchase Details
Closed on
Aug 30, 2004
Sold by
Almeida Agnes
Bought by
Kantsedal Vladimir and Kantsedal Evgenia
Home Financials for this Owner
Home Financials are based on the most recent Mortgage that was taken out on this home.
Original Mortgage
$257,600
Interest Rate
5.37%
Mortgage Type
Unknown
Purchase Details
Closed on
Oct 2, 2003
Sold by
State Bank Of Countryside
Bought by
Almeida Agnes
Home Financials for this Owner
Home Financials are based on the most recent Mortgage that was taken out on this home.
Original Mortgage
$220,000
Interest Rate
5.81%
Mortgage Type
Stand Alone First
Create a Home Valuation Report for This Property
The Home Valuation Report is an in-depth analysis detailing your home's value as well as a comparison with similar homes in the area
Home Values in the Area
Average Home Value in this Area
Purchase History
| Date | Buyer | Sale Price | Title Company |
|---|---|---|---|
| Kantsedal Vladimir | -- | Ticor Title Insurance Co | |
| Kantsedal Vladimir | $322,000 | Multiple | |
| Almeida Agnes | $293,000 | Enterprise Land Title Ltd |
Source: Public Records
Mortgage History
| Date | Status | Borrower | Loan Amount |
|---|---|---|---|
| Open | Kantsedal Vladimir | $234,000 | |
| Closed | Kantsedal Vladimir | $257,600 | |
| Previous Owner | Almeida Agnes | $220,000 |
Source: Public Records
Tax History Compared to Growth
Tax History
| Year | Tax Paid | Tax Assessment Tax Assessment Total Assessment is a certain percentage of the fair market value that is determined by local assessors to be the total taxable value of land and additions on the property. | Land | Improvement |
|---|---|---|---|---|
| 2024 | $9,301 | $37,470 | $3,645 | $33,825 |
| 2023 | $7,618 | $41,237 | $3,645 | $37,592 |
| 2022 | $7,618 | $28,851 | $2,970 | $25,881 |
| 2021 | $7,383 | $28,851 | $2,970 | $25,881 |
| 2020 | $7,170 | $28,851 | $2,970 | $25,881 |
| 2019 | $7,137 | $29,430 | $2,700 | $26,730 |
| 2018 | $6,940 | $29,430 | $2,700 | $26,730 |
| 2017 | $7,160 | $30,817 | $2,700 | $28,117 |
| 2016 | $6,439 | $25,573 | $2,430 | $23,143 |
| 2015 | $6,998 | $27,948 | $2,430 | $25,518 |
| 2014 | $6,910 | $27,948 | $2,430 | $25,518 |
| 2013 | $6,977 | $29,852 | $2,430 | $27,422 |
Source: Public Records
Map
Nearby Homes
- 9411 Albany Ct
- 16121 S 94th Ave
- 9338 Meadowview Dr Unit 9338
- 16040 Boardwalk Ln Unit 4A
- 9225 162nd St
- 16313 Bob White Cir
- 16231 92nd Ave
- 16328 Bob White Cir
- 16515 S La Grange Rd
- 16150 Hillcrest Cir
- 16306 Chickadee Cir
- 9300 Park Place
- 16662 Seton Place Unit 16662
- 15963 91st Ave
- 9404 Lindsay St
- 9337 Waterford Ln Unit D3
- 9350 Waterford Ln Unit C16
- 9291 Erin Ln Unit D7
- 16701 Highview Ave
- 9939 Constitution Ct
- 9432 Providence Square
- 9424 Providence Square
- 9436 Providence Square
- 9433 162nd St
- 9429 162nd St
- 9433 162nd St
- 9425 162nd St
- 9429 162nd St
- 9437 162nd St
- 9437 162nd St
- 9440 Providence Square
- 9439 162nd St
- 9418 Plymouth Ct
- 9441 162nd St
- 9444 Providence Square
- 16224 Providence Square
- 9419 Plymouth Ct
- 9414 Plymouth Ct
- 16228 Providence Square
- 9419 Huber Ct