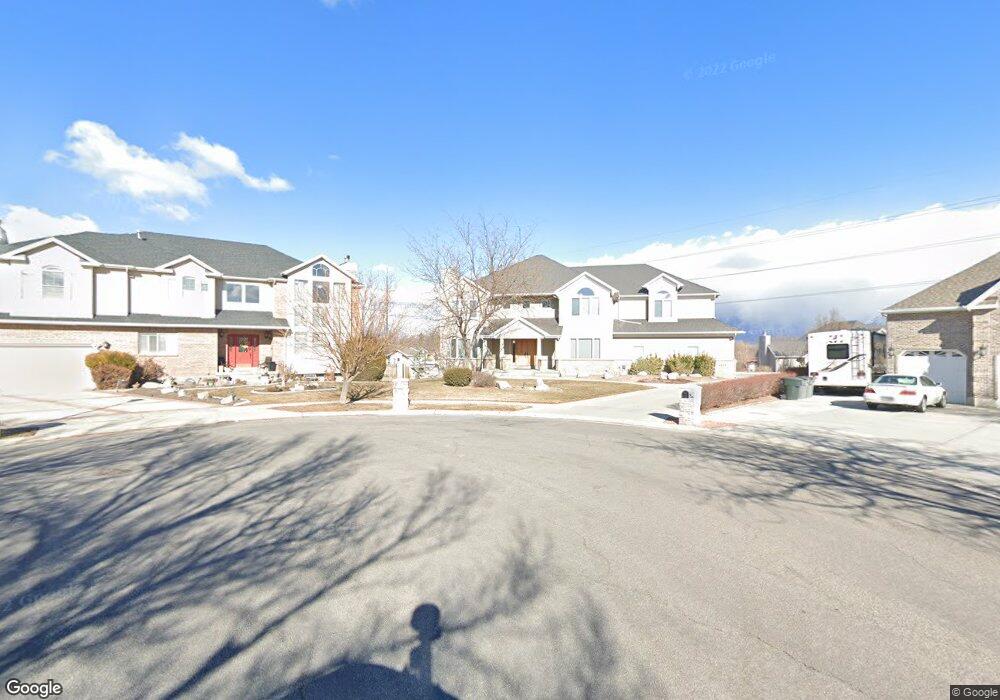
9429 Dunbar Cove South Jordan, UT 84095
Estimated Value: $1,101,000
4
Beds
4
Baths
4,608
Sq Ft
$239/Sq Ft
Est. Value
About This Home
This home is located at 9429 Dunbar Cove, South Jordan, UT 84095 and is currently priced at $1,101,000, approximately $238 per square foot. 9429 Dunbar Cove is a home located in Salt Lake County with nearby schools including Jordan Ridge School, South Jordan Middle School, and Hawthorn Academy.
Ownership History
Date
Name
Owned For
Owner Type
Purchase Details
Closed on
Sep 3, 2020
Sold by
Kemker Leon F and Kemker Kristine B
Bought by
Kemker Leon Eugene and Kemker Kristine Bradley
Current Estimated Value
Purchase Details
Closed on
Sep 11, 2015
Sold by
Kemker Leon
Bought by
Kemker Leon E and Kemker Kristine B
Home Financials for this Owner
Home Financials are based on the most recent Mortgage that was taken out on this home.
Original Mortgage
$319,000
Outstanding Balance
$189,859
Interest Rate
3.86%
Mortgage Type
New Conventional
Purchase Details
Closed on
Jan 8, 1998
Sold by
Kemker Kristine B
Bought by
Kemker Leon E and Kemker Kristine B
Home Financials for this Owner
Home Financials are based on the most recent Mortgage that was taken out on this home.
Original Mortgage
$370,000
Interest Rate
7.05%
Mortgage Type
Purchase Money Mortgage
Create a Home Valuation Report for This Property
The Home Valuation Report is an in-depth analysis detailing your home's value as well as a comparison with similar homes in the area
Home Values in the Area
Average Home Value in this Area
Purchase History
| Date | Buyer | Sale Price | Title Company |
|---|---|---|---|
| Kemker Leon Eugene | -- | Accommodation | |
| Kemker Leon E | -- | Titan Title Ins Agcy Inc | |
| Kemker Leon | -- | Titan Title Ins Agency Inc | |
| Kemker Leon E | -- | -- |
Source: Public Records
Mortgage History
| Date | Status | Borrower | Loan Amount |
|---|---|---|---|
| Open | Kemker Leon | $319,000 | |
| Closed | Kemker Leon E | $319,000 | |
| Closed | Kemker Leon E | $370,000 |
Source: Public Records
Tax History Compared to Growth
Tax History
| Year | Tax Paid | Tax Assessment Tax Assessment Total Assessment is a certain percentage of the fair market value that is determined by local assessors to be the total taxable value of land and additions on the property. | Land | Improvement |
|---|---|---|---|---|
| 2021 | $4,297 | $692,200 | $203,800 | $488,400 |
| 2020 | $4,210 | $635,700 | $143,000 | $492,700 |
| 2019 | $4,186 | $621,400 | $134,900 | $486,500 |
| 2018 | $3,929 | $580,300 | $134,900 | $445,400 |
| 2017 | $3,856 | $558,100 | $134,900 | $423,200 |
| 2016 | $3,863 | $529,800 | $134,900 | $394,900 |
| 2015 | $3,695 | $492,700 | $154,100 | $338,600 |
| 2014 | $3,519 | $461,200 | $146,900 | $314,300 |
Source: Public Records
Map
Nearby Homes
- 1673 Peaceful Cir
- 8686 S Temple Dr
- Brook Haven Plan at Jordan Woods
- Maple Plan at Jordan Woods
- The Maple Basement Plan at Jordan Woods
- The Evergreen Basement Plan at Jordan Woods
- 9503 S Tirado Cove Unit 203
- 9511 S Tirado Cove Unit 204
- 1719 W Brocious Way Unit 301
- 9635 S 1600 W
- 1753 Rylie Ann Cir
- 1741 W Nikos Ln
- 9141 S Little Creek Dr
- 1718 W Thira Ln
- 9496 S 1930 W
- 1767 W Ikaros Ln
- 1788 W Ikaros Ln
- 9414 S 1980 W
- 1968 W 9270 S Unit C
- 9297 S Avignon Place
- 9423 Dunbar Cove
- 9433 Dunbar Cove
- 9422 Morywood Cir
- 9422 S Morywood Cir
- 1505 Misty Fen Way
- 1505 W Misty Fen Way
- 1521 Misty Fen Way
- 1521 W Misty Fen Way Unit 50
- 1485 Misty Fen Way
- 9428 Dunbar Cove
- 9445 Dunbar Cove
- 9446 Morywood Cir
- 1533 Misty Fen Way
- 9432 Dunbar Cove
- 1471 W Misty Fen Way
- 1471 Misty Fen Way
- 9418 S Morywood Cir
- 9418 Morywood Cir
- 1456 W 9380 S Unit 37
- 1547 Misty Fen Way