Estimated Value: $51,000 - $92,000
1
Bed
1
Bath
945
Sq Ft
$75/Sq Ft
Est. Value
About This Home
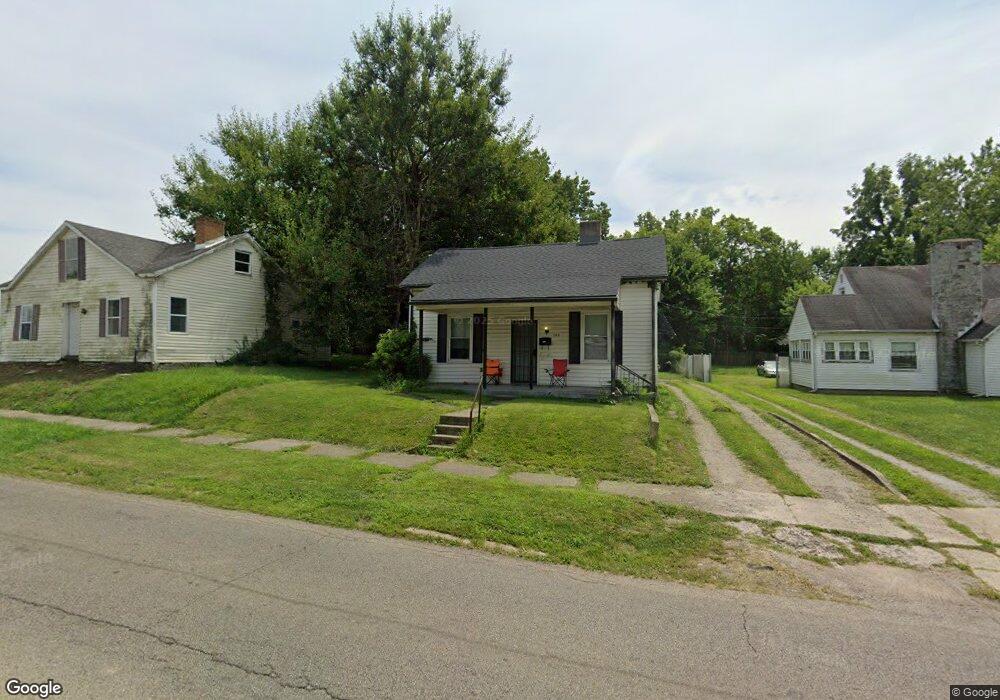
This home is located at 943 E Main St, Xenia, OH 45385 and is currently estimated at $71,055, approximately $75 per square foot. 943 E Main St is a home located in Greene County with nearby schools including Xenia High School, Summit Academy Community School for Alternative Learners - Xenia, and Legacy Christian Academy.
Ownership History
Date
Name
Owned For
Owner Type
Purchase Details
Closed on
Aug 13, 2004
Sold by
Deutsche Bank National Trust Co
Bought by
Pamer Joseph M and Pamer Theresa M
Current Estimated Value
Purchase Details
Closed on
Jun 22, 2004
Sold by
Seagraves Harold and Seagraves Georgia
Bought by
Deutsche Bank National Trust Co and Bankers Trust Co
Purchase Details
Closed on
Feb 28, 2003
Sold by
Seagraves Georgia and Seagraves Harold
Bought by
Seagraves Harold
Purchase Details
Closed on
Oct 27, 1998
Sold by
The Pacesetter Corp
Bought by
Seagraves Harold and Seagraves Georgia
Home Financials for this Owner
Home Financials are based on the most recent Mortgage that was taken out on this home.
Original Mortgage
$3,080
Interest Rate
14.83%
Mortgage Type
Seller Take Back
Create a Home Valuation Report for This Property
The Home Valuation Report is an in-depth analysis detailing your home's value as well as a comparison with similar homes in the area
Home Values in the Area
Average Home Value in this Area
Purchase History
| Date | Buyer | Sale Price | Title Company |
|---|---|---|---|
| Pamer Joseph M | $27,900 | Resource Title Agency Inc | |
| Deutsche Bank National Trust Co | $32,000 | -- | |
| Seagraves Harold | -- | -- | |
| Seagraves Harold | $3,834 | -- |
Source: Public Records
Mortgage History
| Date | Status | Borrower | Loan Amount |
|---|---|---|---|
| Previous Owner | Seagraves Harold | $3,080 |
Source: Public Records
Tax History
| Year | Tax Paid | Tax Assessment Tax Assessment Total Assessment is a certain percentage of the fair market value that is determined by local assessors to be the total taxable value of land and additions on the property. | Land | Improvement |
|---|---|---|---|---|
| 2024 | $674 | $15,480 | $2,140 | $13,340 |
| 2023 | $662 | $15,480 | $2,140 | $13,340 |
| 2022 | $569 | $11,340 | $1,940 | $9,400 |
| 2021 | $577 | $11,340 | $1,940 | $9,400 |
| 2020 | $552 | $11,340 | $1,940 | $9,400 |
| 2019 | $524 | $10,130 | $2,080 | $8,050 |
| 2018 | $526 | $10,130 | $2,080 | $8,050 |
| 2017 | $511 | $10,130 | $2,080 | $8,050 |
| 2016 | $517 | $9,770 | $2,080 | $7,690 |
| 2015 | $519 | $9,770 | $2,080 | $7,690 |
| 2014 | $497 | $9,770 | $2,080 | $7,690 |
Source: Public Records
Map
Nearby Homes
Your Personal Tour Guide
Ask me questions while you tour the home.