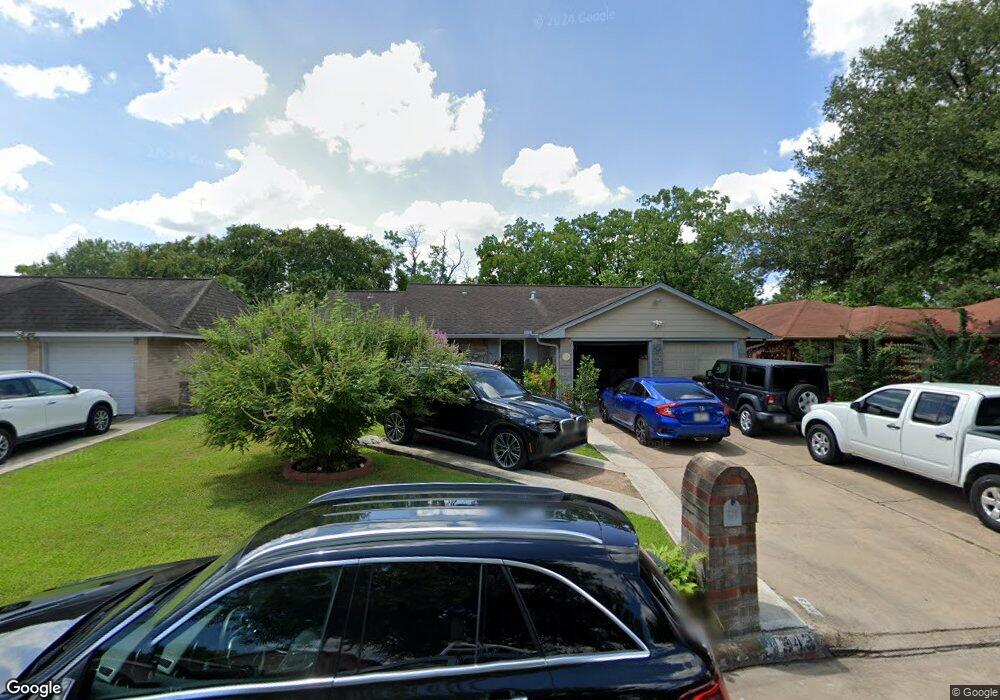
943 Fruitvale Dr Houston, TX 77038
North Houston NeighborhoodEstimated Value: $211,294 - $220,000
3
Beds
2
Baths
1,481
Sq Ft
$145/Sq Ft
Est. Value
About This Home
This home is located at 943 Fruitvale Dr, Houston, TX 77038 and is currently estimated at $215,074, approximately $145 per square foot. 943 Fruitvale Dr is a home located in Harris County with nearby schools including Jerry Keeble Ec/Pre-K, Gray Elementary School, and Aldine Ninth Grade School.
Ownership History
Date
Name
Owned For
Owner Type
Purchase Details
Closed on
Jun 9, 1999
Sold by
Chandler Loyd B
Bought by
Garcia Jose L
Current Estimated Value
Home Financials for this Owner
Home Financials are based on the most recent Mortgage that was taken out on this home.
Original Mortgage
$50,300
Outstanding Balance
$13,124
Interest Rate
6.92%
Estimated Equity
$201,950
Create a Home Valuation Report for This Property
The Home Valuation Report is an in-depth analysis detailing your home's value as well as a comparison with similar homes in the area
Home Values in the Area
Average Home Value in this Area
Purchase History
| Date | Buyer | Sale Price | Title Company |
|---|---|---|---|
| Garcia Jose L | -- | -- |
Source: Public Records
Mortgage History
| Date | Status | Borrower | Loan Amount |
|---|---|---|---|
| Open | Garcia Jose L | $50,300 |
Source: Public Records
Tax History Compared to Growth
Tax History
| Year | Tax Paid | Tax Assessment Tax Assessment Total Assessment is a certain percentage of the fair market value that is determined by local assessors to be the total taxable value of land and additions on the property. | Land | Improvement |
|---|---|---|---|---|
| 2025 | $1,945 | $207,800 | $32,232 | $175,568 |
| 2024 | $1,945 | $207,800 | $32,232 | $175,568 |
| 2023 | $1,945 | $211,176 | $32,232 | $178,944 |
| 2022 | $3,141 | $165,934 | $25,517 | $140,417 |
| 2021 | $2,978 | $136,233 | $26,055 | $110,178 |
| 2020 | $2,883 | $125,537 | $24,980 | $100,557 |
| 2019 | $2,725 | $115,552 | $24,980 | $90,572 |
| 2018 | $979 | $117,091 | $12,324 | $104,767 |
| 2017 | $2,183 | $117,091 | $12,324 | $104,767 |
| 2016 | $1,984 | $96,980 | $12,324 | $84,656 |
| 2015 | $693 | $96,980 | $12,324 | $84,656 |
| 2014 | $693 | $78,183 | $12,324 | $65,859 |
Source: Public Records
Map
Nearby Homes
- 1006 Fruitvale Dr
- 1010 Francitas Dr
- 10134 Lasaber Ct
- 1022 Progreso Dr
- 10226 Ella Falls Blvd
- 10026 Lasaber Ct
- 1138 Cherry Spring Dr
- 939 Point Blank Dr
- 1219 Pilot Point Dr
- 1506 Wilshire Park Dr
- 1019 Castolan Dr
- 1327 Fallbrook Dr
- 10519 Pleasanton Dr
- 00 Fallbrook Dr
- 0 W Mt Houston Rd Unit 90464120
- 10558 Pleasanton Dr
- 2115 Havencrest Dr
- 9710 Debbie Ln
- 2203 Chalet Rd
- 12718 Sai Baba Dr
- 939 Fruitvale Dr
- 947 Fruitvale Dr
- 950 Crestbrook Dr
- 1003 Fruitvale Dr
- 935 Fruitvale Dr
- 946 Crestbrook Dr
- 954 Crestbrook Dr
- 1002 Crestbrook Dr
- 942 Crestbrook Dr
- 942 Fruitvale Dr
- 938 Fruitvale Dr
- 946 Fruitvale Dr
- 1007 Fruitvale Dr
- 931 Fruitvale Dr
- 934 Fruitvale Dr
- 1002 Fruitvale Dr
- 1006 Crestbrook Dr
- 938 Crestbrook Dr
- 930 Fruitvale Dr
- 1011 Fruitvale Dr