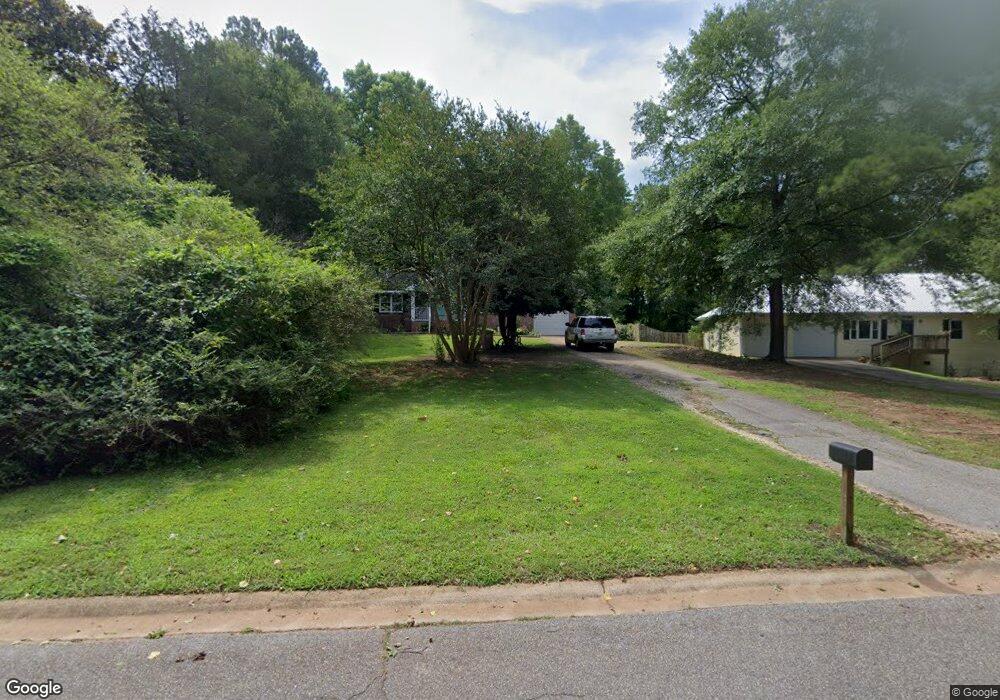
943 Honeysuckle Trail Winder, GA 30680
Estimated Value: $270,000 - $308,000
3
Beds
2
Baths
1,704
Sq Ft
$168/Sq Ft
Est. Value
About This Home
This home is located at 943 Honeysuckle Trail, Winder, GA 30680 and is currently estimated at $285,944, approximately $167 per square foot. 943 Honeysuckle Trail is a home located in Barrow County with nearby schools including Holsenbeck Elementary School, Bear Creek Middle School, and Winder-Barrow High School.
Ownership History
Date
Name
Owned For
Owner Type
Purchase Details
Closed on
Jan 31, 2018
Sold by
Chatham Shane
Bought by
Worley Christopher S
Current Estimated Value
Home Financials for this Owner
Home Financials are based on the most recent Mortgage that was taken out on this home.
Original Mortgage
$110,000
Outstanding Balance
$92,851
Interest Rate
3.95%
Mortgage Type
New Conventional
Estimated Equity
$193,093
Purchase Details
Closed on
Jul 22, 2002
Sold by
Citifinancial Mtg Co
Bought by
Chatham Shane
Home Financials for this Owner
Home Financials are based on the most recent Mortgage that was taken out on this home.
Original Mortgage
$81,050
Interest Rate
6.53%
Mortgage Type
New Conventional
Purchase Details
Closed on
Mar 12, 2002
Sold by
Ledbetter Billy R and Ledbetter Sheryl
Bought by
Citifinancial Mtg Co
Purchase Details
Closed on
Jan 2, 2002
Sold by
Ledbetter Billy R
Bought by
Associates Financial Services
Create a Home Valuation Report for This Property
The Home Valuation Report is an in-depth analysis detailing your home's value as well as a comparison with similar homes in the area
Home Values in the Area
Average Home Value in this Area
Purchase History
| Date | Buyer | Sale Price | Title Company |
|---|---|---|---|
| Worley Christopher S | $110,000 | -- | |
| Chatham Shane | $82,400 | -- | |
| Citifinancial Mtg Co | $92,667 | -- | |
| Associates Financial Services | $92,667 | -- | |
| Citifinancial Mortga | -- | -- |
Source: Public Records
Mortgage History
| Date | Status | Borrower | Loan Amount |
|---|---|---|---|
| Open | Worley Christopher S | $110,000 | |
| Previous Owner | Chatham Shane | $81,050 |
Source: Public Records
Tax History Compared to Growth
Tax History
| Year | Tax Paid | Tax Assessment Tax Assessment Total Assessment is a certain percentage of the fair market value that is determined by local assessors to be the total taxable value of land and additions on the property. | Land | Improvement |
|---|---|---|---|---|
| 2024 | $2,116 | $85,438 | $20,400 | $65,038 |
| 2023 | $2,109 | $85,638 | $20,400 | $65,238 |
| 2022 | $1,816 | $63,194 | $16,000 | $47,194 |
| 2021 | $1,684 | $55,362 | $16,000 | $39,362 |
| 2020 | $1,642 | $53,796 | $16,000 | $37,796 |
| 2019 | $1,672 | $53,796 | $16,000 | $37,796 |
| 2018 | $1,565 | $50,928 | $10,000 | $40,928 |
| 2017 | $1,161 | $39,870 | $10,000 | $29,870 |
| 2016 | $1,220 | $39,870 | $10,000 | $29,870 |
| 2015 | $1,136 | $36,903 | $10,000 | $26,903 |
| 2014 | $1,015 | $31,803 | $4,900 | $26,903 |
| 2013 | -- | $32,693 | $4,900 | $27,793 |
Source: Public Records
Map
Nearby Homes
- 173 Equestrian Walk
- 273 Greystone Ct
- 855 Crystal Meadow Dr
- 826 Crystal Meadow Dr
- 662 Carla Ct
- 547 Hickeria Way
- 1328 Jefferson Hwy
- 624 Skyland Dr
- 421 Arrowhatchee Dr
- 162 Delightful Way Unit 28
- 230 Delightful Way Unit 23
- 296 Delightful Way Unit 22
- 63 Delightful Way Unit 1
- 203 Delightful Way Unit 5
- 253 Delightful Way Unit 6
- 281 Delightful Way Unit 7
- 372 Ashton Way
- 752 Moon Bridge Rd
- 0 Hancock Bridge Rd Unit 10535063
- 809 Moon Bridge Rd
- 941 Honeysuckle Trail
- 939 Honeysuckle Trail
- 947 Honeysuckle Trail
- 937 Honeysuckle Trail
- 940 Honeysuckle Trail
- 944 Honeysuckle Trail
- 946 Honeysuckle Trail
- 951 Honeysuckle Trail
- 948 Honeysuckle Trail
- 1219 Ora Lee Ln Unit 27
- 1219 Ora Lee Ln
- 950 Honeysuckle Trail
- 953 Honeysuckle Trail
- 935 Dogwood Trail
- 933 Dogwood Trail
- 937 Dogwood Trail
- 931 Dogwood Trail
- 933 Honeysuckle Trail
- 952 Honeysuckle Trail
- 929 Dogwood Trail