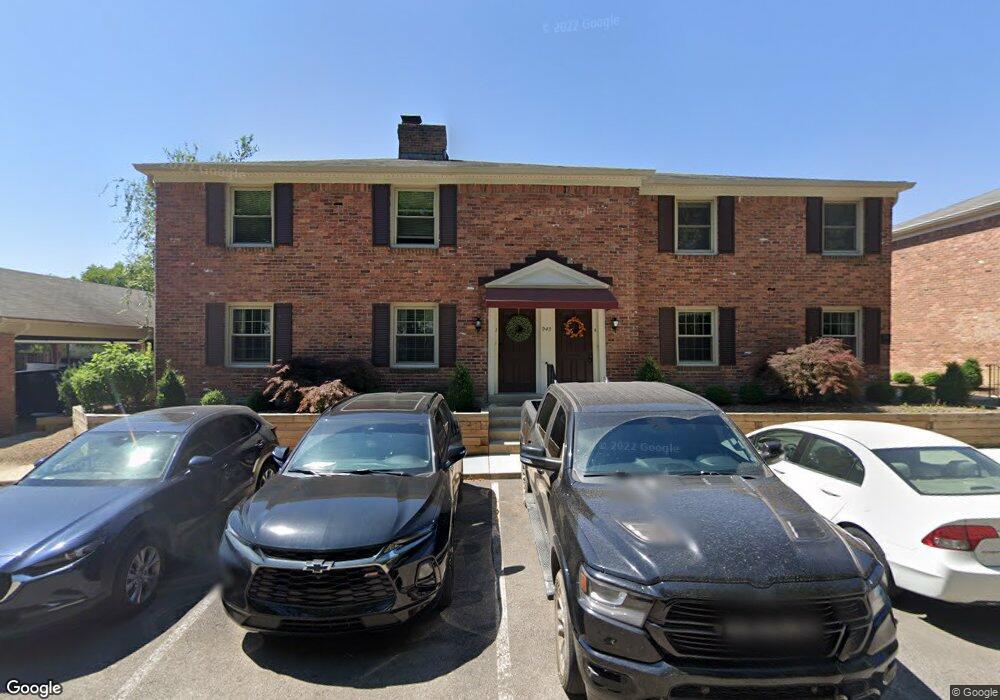
943 Manor Ln Unit 943Q Columbus, OH 43221
Cranbrook NeighborhoodEstimated Value: $197,000 - $218,000
2
Beds
2
Baths
1,088
Sq Ft
$193/Sq Ft
Est. Value
About This Home
This home is located at 943 Manor Ln Unit 943Q, Columbus, OH 43221 and is currently estimated at $209,535, approximately $192 per square foot. 943 Manor Ln Unit 943Q is a home located in Franklin County with nearby schools including Cranbrook Elementary School, Ridgeview Middle School, and Centennial High School.
Ownership History
Date
Name
Owned For
Owner Type
Purchase Details
Closed on
Oct 11, 2014
Sold by
Meyer Richard A
Bought by
Boales Shelley G
Current Estimated Value
Home Financials for this Owner
Home Financials are based on the most recent Mortgage that was taken out on this home.
Original Mortgage
$105,450
Interest Rate
4.23%
Mortgage Type
New Conventional
Purchase Details
Closed on
Nov 26, 2003
Sold by
Winters Mary Eloise and Kirwin Daniel J
Bought by
Meyer Richard A
Home Financials for this Owner
Home Financials are based on the most recent Mortgage that was taken out on this home.
Original Mortgage
$70,250
Interest Rate
6.01%
Mortgage Type
Purchase Money Mortgage
Purchase Details
Closed on
Apr 10, 1981
Bought by
Winters Eloise
Create a Home Valuation Report for This Property
The Home Valuation Report is an in-depth analysis detailing your home's value as well as a comparison with similar homes in the area
Home Values in the Area
Average Home Value in this Area
Purchase History
| Date | Buyer | Sale Price | Title Company |
|---|---|---|---|
| Boales Shelley G | $117,000 | Amerititle | |
| Meyer Richard A | $94,300 | Amerititle Agency Inc | |
| Winters Eloise | -- | -- |
Source: Public Records
Mortgage History
| Date | Status | Borrower | Loan Amount |
|---|---|---|---|
| Previous Owner | Boales Shelley G | $105,450 | |
| Previous Owner | Meyer Richard A | $70,250 |
Source: Public Records
Tax History Compared to Growth
Tax History
| Year | Tax Paid | Tax Assessment Tax Assessment Total Assessment is a certain percentage of the fair market value that is determined by local assessors to be the total taxable value of land and additions on the property. | Land | Improvement |
|---|---|---|---|---|
| 2024 | $3,093 | $68,920 | $12,780 | $56,140 |
| 2023 | $3,054 | $68,915 | $12,775 | $56,140 |
| 2022 | $2,429 | $46,830 | $5,040 | $41,790 |
| 2021 | $2,433 | $46,830 | $5,040 | $41,790 |
| 2020 | $2,436 | $46,830 | $5,040 | $41,790 |
| 2019 | $2,368 | $39,030 | $4,200 | $34,830 |
| 2018 | $2,213 | $39,030 | $4,200 | $34,830 |
| 2017 | $2,319 | $39,030 | $4,200 | $34,830 |
| 2016 | $2,272 | $34,300 | $5,670 | $28,630 |
| 2015 | $2,063 | $34,300 | $5,670 | $28,630 |
| 2014 | $2,068 | $34,300 | $5,670 | $28,630 |
| 2013 | $1,020 | $34,300 | $5,670 | $28,630 |
Source: Public Records
Map
Nearby Homes
- 965 Manor Ln Unit W
- 965 Manor Ln Unit P
- 3051 Wilce Ave
- 1098 Stanhope Dr
- 667 Riverview Dr
- 1205 Sunny Hill Dr
- 3311 Mansion Way
- 1121 Afton Rd
- 1016 Lambeth Dr
- 1059 Lambeth Dr
- 1310 Stoneygate Ln
- 1315 La Rochelle Dr Unit B2U
- 1311 La Rochelle Dr Unit B2L
- 3526 Rue de Fleur Unit B18U
- 2708 Mount Holyoke Rd
- 1560 Pemberton Dr
- 3281 Milton Ave
- 2727 Westmont Blvd
- 187 W Pacemont Rd Unit 189
- 1109 Millcreek Ln
- 943 Manor Ln Unit 9433
- 943 Manor Ln
- 943 Manor Ln Unit 943B
- 943 Manor Ln Unit 943R
- 943 Manor Ln Unit 943A
- 943 Manor Ln Unit 943
- 943 Manor Ln Unit 943F
- 943 Manor Ln Unit 943C
- 943 Manor Ln
- 943 Manor Ln
- 943 Manor Ln
- 943 Manor Ln
- 943 Manor Ln
- 943 Manor Ln
- 943 Manor Ln Unit 943E
- 943 Manor Ln Unit H
- 943 Manor Ln Unit C
- 943 Manor Ln Unit M
- 943 Manor Ln Unit B
- 943 Manor Ln Unit Q