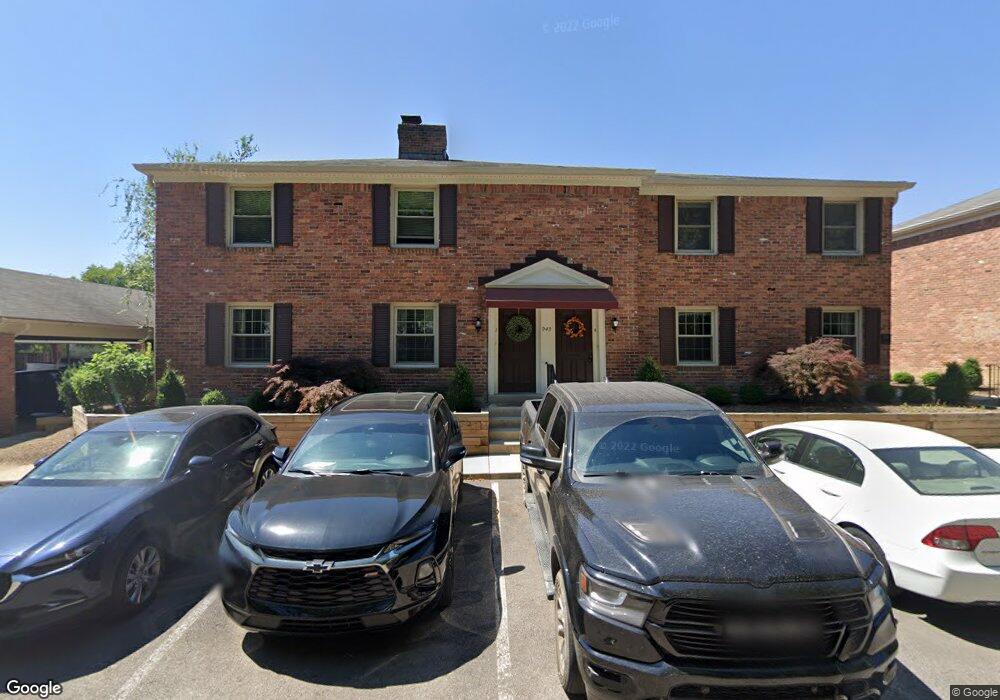
943 Manor Ln Columbus, OH 43221
Cranbrook NeighborhoodEstimated Value: $286,000 - $339,000
3
Beds
2
Baths
1,690
Sq Ft
$186/Sq Ft
Est. Value
About This Home
This home is located at 943 Manor Ln, Columbus, OH 43221 and is currently estimated at $314,838, approximately $186 per square foot. 943 Manor Ln is a home located in Franklin County with nearby schools including Cranbrook Elementary School, Ridgeview Middle School, and Centennial High School.
Ownership History
Date
Name
Owned For
Owner Type
Purchase Details
Closed on
Dec 14, 2021
Sold by
Sommer Blane and Sommer Nancy
Bought by
Miller Ryan and Miller Rachel
Current Estimated Value
Home Financials for this Owner
Home Financials are based on the most recent Mortgage that was taken out on this home.
Original Mortgage
$240,825
Outstanding Balance
$223,307
Interest Rate
3.11%
Mortgage Type
Credit Line Revolving
Estimated Equity
$93,367
Purchase Details
Closed on
Aug 23, 2017
Sold by
Ack Jacklyn H
Bought by
Sommer Blane and Sommer Nancy
Purchase Details
Closed on
Sep 3, 1996
Sold by
Koontz John
Bought by
Jacklyn H Ack
Home Financials for this Owner
Home Financials are based on the most recent Mortgage that was taken out on this home.
Original Mortgage
$50,000
Interest Rate
8.3%
Mortgage Type
New Conventional
Purchase Details
Closed on
Oct 1, 1980
Create a Home Valuation Report for This Property
The Home Valuation Report is an in-depth analysis detailing your home's value as well as a comparison with similar homes in the area
Home Values in the Area
Average Home Value in this Area
Purchase History
| Date | Buyer | Sale Price | Title Company |
|---|---|---|---|
| Miller Ryan | $253,500 | Title One | |
| Sommer Blane | $150,000 | Valmer Land Title | |
| Jacklyn H Ack | $91,500 | -- | |
| -- | $68,400 | -- |
Source: Public Records
Mortgage History
| Date | Status | Borrower | Loan Amount |
|---|---|---|---|
| Open | Miller Ryan | $240,825 | |
| Previous Owner | Ack Jacklyn H | $50,000 | |
| Previous Owner | Jacklyn H Ack | $50,000 |
Source: Public Records
Tax History Compared to Growth
Tax History
| Year | Tax Paid | Tax Assessment Tax Assessment Total Assessment is a certain percentage of the fair market value that is determined by local assessors to be the total taxable value of land and additions on the property. | Land | Improvement |
|---|---|---|---|---|
| 2024 | $3,520 | $78,440 | $12,780 | $65,660 |
| 2023 | $3,475 | $78,435 | $12,775 | $65,660 |
| 2022 | $2,850 | $54,950 | $5,040 | $49,910 |
| 2021 | $2,925 | $54,950 | $5,040 | $49,910 |
| 2020 | $2,930 | $54,950 | $5,040 | $49,910 |
| 2019 | $2,847 | $45,780 | $4,200 | $41,580 |
| 2018 | $2,421 | $45,780 | $4,200 | $41,580 |
| 2017 | $2,775 | $45,780 | $4,200 | $41,580 |
| 2016 | $2,203 | $42,000 | $7,350 | $34,650 |
| 2015 | $1,999 | $42,000 | $7,350 | $34,650 |
| 2014 | $2,004 | $42,000 | $7,350 | $34,650 |
| 2013 | $989 | $42,000 | $7,350 | $34,650 |
Source: Public Records
Map
Nearby Homes
- 965 Manor Ln Unit W
- 965 Manor Ln Unit P
- 769 Harley Dr
- 1098 Stanhope Dr
- 922 Afton Rd
- 3121 Edgefield Rd
- 515 Riverview Dr
- 1121 Afton Rd
- 2971 Wellesley Dr
- 2832 Mount Holyoke Rd Unit D
- 3526 Rue de Fleur Unit B18U
- 3170 Brandon Rd
- 255-257 W Lakeview Ave
- 3050 Northwest Blvd Unit 52
- 2727 Westmont Blvd
- 200 W Pacemont Rd
- 187 W Pacemont Rd Unit 189
- 2751 Brandon Rd
- 159-161 Delhi Ave
- 2735 Brandon Rd
- 943 Manor Ln Unit 9433
- 943 Manor Ln
- 943 Manor Ln Unit 943B
- 943 Manor Ln Unit 943R
- 943 Manor Ln Unit 943A
- 943 Manor Ln Unit 943
- 943 Manor Ln Unit 943F
- 943 Manor Ln Unit 943C
- 943 Manor Ln
- 943 Manor Ln Unit 943Q
- 943 Manor Ln
- 943 Manor Ln
- 943 Manor Ln
- 943 Manor Ln
- 943 Manor Ln Unit 943E
- 943 Manor Ln Unit H
- 943 Manor Ln Unit C
- 943 Manor Ln Unit M
- 943 Manor Ln Unit B
- 943 Manor Ln Unit Q