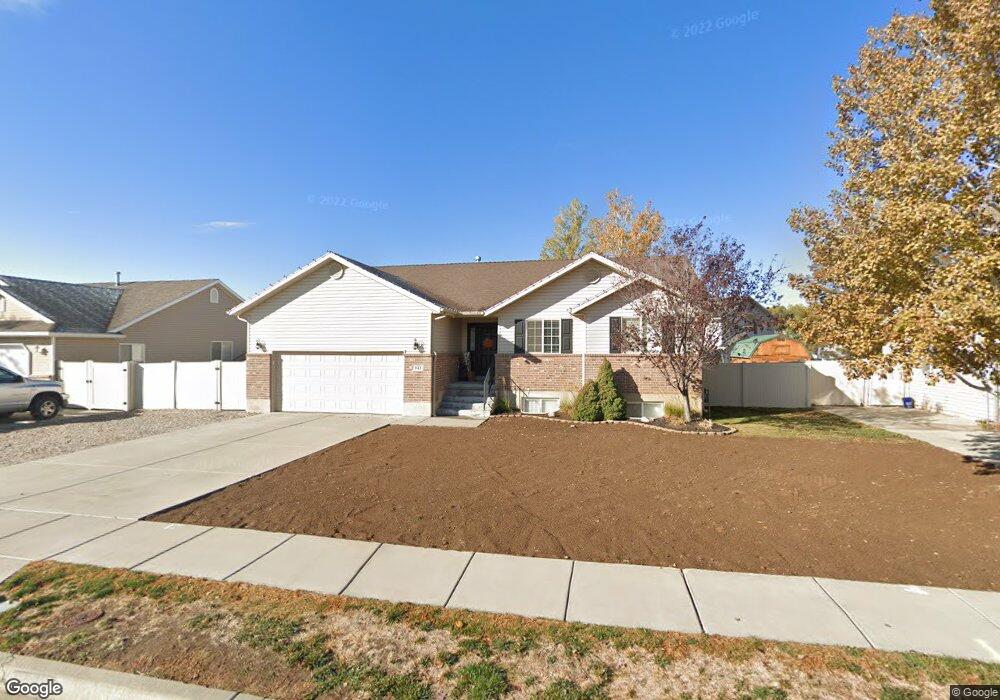
943 N 780 W Clearfield, UT 84015
Estimated Value: $473,000 - $541,000
6
Beds
3
Baths
2,586
Sq Ft
$200/Sq Ft
Est. Value
About This Home
This home is located at 943 N 780 W, Clearfield, UT 84015 and is currently estimated at $516,980, approximately $199 per square foot. 943 N 780 W is a home located in Davis County with nearby schools including Clinton Elementary School, Sunset Junior High School, and Clearfield High School.
Ownership History
Date
Name
Owned For
Owner Type
Purchase Details
Closed on
Aug 26, 2024
Sold by
Kiesz John and Kiesz Rachel
Bought by
Gomez Karen and Medina Jason
Current Estimated Value
Home Financials for this Owner
Home Financials are based on the most recent Mortgage that was taken out on this home.
Original Mortgage
$525,309
Outstanding Balance
$519,387
Interest Rate
6.89%
Mortgage Type
FHA
Estimated Equity
-$2,407
Purchase Details
Closed on
May 26, 2016
Sold by
Kiesz John L and Kiesz Rachel
Bought by
Kiesz John L and Kiesz Rachel
Purchase Details
Closed on
Feb 16, 2012
Sold by
Tracy Rodney and Tracy Amy
Bought by
Kiesz John L and Kiesz Rachel
Home Financials for this Owner
Home Financials are based on the most recent Mortgage that was taken out on this home.
Original Mortgage
$164,715
Interest Rate
3.75%
Mortgage Type
FHA
Purchase Details
Closed on
Aug 18, 2009
Sold by
Rock Island Investments Lp
Bought by
Tracy Rodney
Home Financials for this Owner
Home Financials are based on the most recent Mortgage that was taken out on this home.
Original Mortgage
$6,755
Interest Rate
5.17%
Mortgage Type
Stand Alone Second
Purchase Details
Closed on
Aug 13, 2009
Sold by
Tracy Rodney
Bought by
Tracy Rodney and Tracy Amy
Home Financials for this Owner
Home Financials are based on the most recent Mortgage that was taken out on this home.
Original Mortgage
$6,755
Interest Rate
5.17%
Mortgage Type
Stand Alone Second
Purchase Details
Closed on
Jan 23, 2004
Sold by
Fremont Investments Llc
Bought by
Rock Island Investments Lp
Home Financials for this Owner
Home Financials are based on the most recent Mortgage that was taken out on this home.
Original Mortgage
$200,000
Interest Rate
5.86%
Mortgage Type
Stand Alone Second
Purchase Details
Closed on
Jan 16, 2004
Sold by
Faerber David M
Bought by
Freemont Investments Llc
Home Financials for this Owner
Home Financials are based on the most recent Mortgage that was taken out on this home.
Original Mortgage
$200,000
Interest Rate
5.86%
Mortgage Type
Stand Alone Second
Create a Home Valuation Report for This Property
The Home Valuation Report is an in-depth analysis detailing your home's value as well as a comparison with similar homes in the area
Home Values in the Area
Average Home Value in this Area
Purchase History
| Date | Buyer | Sale Price | Title Company |
|---|---|---|---|
| Gomez Karen | -- | Backman Title Services | |
| Kiesz John L | -- | None Available | |
| Kiesz John L | -- | Lincoln Title Insura | |
| Tracy Rodney | -- | Bonneville Superior Ti | |
| Tracy Rodney | -- | Utah Commercial Title Co | |
| Rock Island Investments Lp | -- | Bonneville Title Company Inc | |
| Freemont Investments Llc | -- | Bonneville Title Company Inc | |
| Freemont Investments Llc | -- | Bonneville Title Company Inc |
Source: Public Records
Mortgage History
| Date | Status | Borrower | Loan Amount |
|---|---|---|---|
| Open | Gomez Karen | $525,309 | |
| Previous Owner | Kiesz John L | $164,715 | |
| Previous Owner | Tracy Rodney | $6,755 | |
| Previous Owner | Tracy Rodney | $189,504 | |
| Previous Owner | Freemont Investments Llc | $200,000 |
Source: Public Records
Tax History Compared to Growth
Tax History
| Year | Tax Paid | Tax Assessment Tax Assessment Total Assessment is a certain percentage of the fair market value that is determined by local assessors to be the total taxable value of land and additions on the property. | Land | Improvement |
|---|---|---|---|---|
| 2025 | $2,763 | $265,650 | $88,773 | $176,877 |
| 2024 | $2,515 | $243,100 | $97,742 | $145,358 |
| 2023 | $2,309 | $413,000 | $110,923 | $302,077 |
| 2022 | $2,485 | $245,850 | $68,201 | $177,649 |
| 2021 | $2,262 | $332,000 | $84,789 | $247,211 |
| 2020 | $1,976 | $287,000 | $71,735 | $215,265 |
| 2019 | $1,917 | $272,000 | $84,406 | $187,594 |
| 2018 | $1,786 | $249,000 | $71,368 | $177,632 |
| 2016 | $1,573 | $113,245 | $27,726 | $85,519 |
| 2015 | $1,563 | $106,975 | $27,726 | $79,249 |
| 2014 | $1,526 | $106,072 | $27,726 | $78,346 |
| 2013 | -- | $96,796 | $27,143 | $69,653 |
Source: Public Records
Map
Nearby Homes