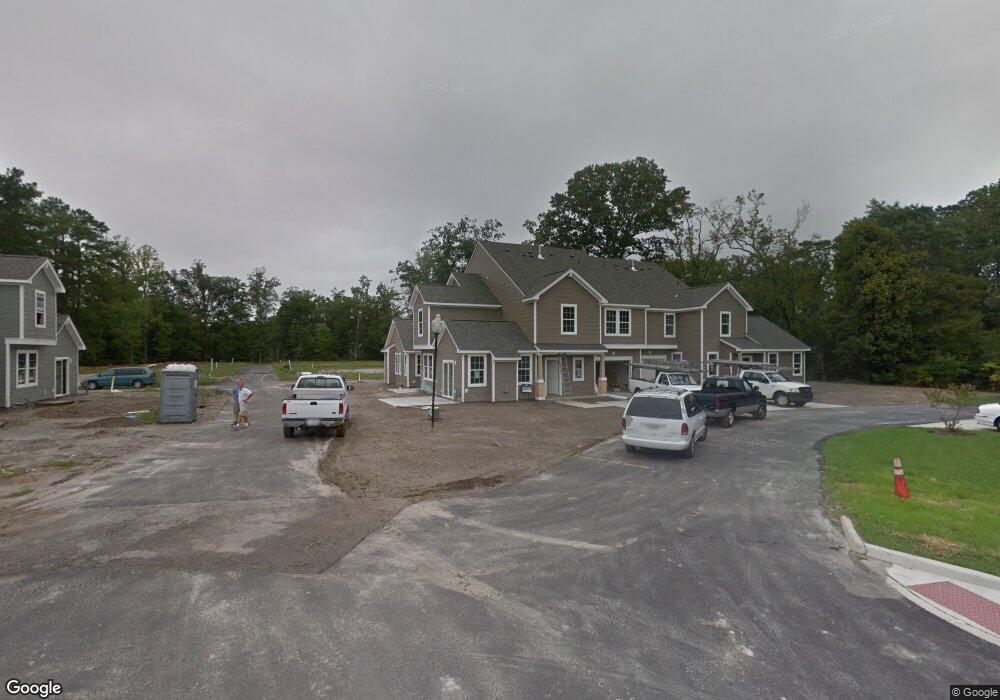
943 Vineyard Place Unit D Suffolk, VA 23435
Sleepy Hole NeighborhoodEstimated Value: $345,303 - $359,000
4
Beds
3
Baths
1,739
Sq Ft
$203/Sq Ft
Est. Value
About This Home
This home is located at 943 Vineyard Place Unit D, Suffolk, VA 23435 and is currently estimated at $353,576, approximately $203 per square foot. 943 Vineyard Place Unit D is a home located in Suffolk City with nearby schools including Creekside Elementary School, John Yeates Middle School, and Nansemond River High School.
Ownership History
Date
Name
Owned For
Owner Type
Purchase Details
Closed on
Aug 14, 2017
Sold by
Traficante Gene E and Traficante Lily S
Bought by
Hood Enoch C and Hood Katrina M
Current Estimated Value
Home Financials for this Owner
Home Financials are based on the most recent Mortgage that was taken out on this home.
Original Mortgage
$245,373
Outstanding Balance
$205,714
Interest Rate
4.4%
Mortgage Type
FHA
Estimated Equity
$147,862
Purchase Details
Closed on
Oct 20, 2014
Sold by
Vineyards @ Bennetts Creek Squ
Bought by
Traficante Gene E
Home Financials for this Owner
Home Financials are based on the most recent Mortgage that was taken out on this home.
Original Mortgage
$233,740
Interest Rate
4.09%
Mortgage Type
VA
Create a Home Valuation Report for This Property
The Home Valuation Report is an in-depth analysis detailing your home's value as well as a comparison with similar homes in the area
Home Values in the Area
Average Home Value in this Area
Purchase History
| Date | Buyer | Sale Price | Title Company |
|---|---|---|---|
| Hood Enoch C | $249,900 | Attorney | |
| Traficante Gene E | $226,273 | -- |
Source: Public Records
Mortgage History
| Date | Status | Borrower | Loan Amount |
|---|---|---|---|
| Open | Hood Enoch C | $245,373 | |
| Previous Owner | Traficante Gene E | $233,740 |
Source: Public Records
Tax History
| Year | Tax Paid | Tax Assessment Tax Assessment Total Assessment is a certain percentage of the fair market value that is determined by local assessors to be the total taxable value of land and additions on the property. | Land | Improvement |
|---|---|---|---|---|
| 2025 | $3,670 | $334,600 | $50,000 | $284,600 |
| 2024 | $3,670 | $323,400 | $50,000 | $273,400 |
| 2023 | $3,550 | $314,300 | $50,000 | $264,300 |
| 2022 | $3,025 | $277,500 | $50,000 | $227,500 |
| 2021 | $2,601 | $234,300 | $40,000 | $194,300 |
| 2020 | $2,621 | $236,100 | $40,000 | $196,100 |
| 2019 | $2,533 | $228,200 | $40,000 | $188,200 |
| 2018 | $2,457 | $222,100 | $40,000 | $182,100 |
| 2017 | $2,376 | $222,100 | $40,000 | $182,100 |
| 2016 | $2,448 | $222,100 | $40,000 | $182,100 |
| 2015 | -- | $222,100 | $40,000 | $182,100 |
| 2014 | -- | $78,100 | $40,000 | $38,100 |
Source: Public Records
Map
Nearby Homes
- 943 Vineyard Place Unit B
- 943 Vineyard Place Unit A
- 943 Vineyard Place Unit C
- 943 Vineyard Place
- 945 Vineyard Place Unit A
- 945 Vineyard Place Unit D
- 945 Vineyard Place
- 945 Vineyard Place Unit C
- 945 Vineyard Place
- 941 Vineyard Place Unit A
- 941 Vineyard Place Unit D
- 941 Vineyard Place Unit B
- 941 Vineyard Place Unit C
- 931 Vineyard Place Unit 931-A
- 931 Vineyard Place Unit D
- 931 Vineyard Place Unit A
- 931 Vineyard Place Unit C
- 933 Vineyard Place Unit B
- 933 Vineyard Place Unit A
- 947 Vineyard Place Unit C
Your Personal Tour Guide
Ask me questions while you tour the home.