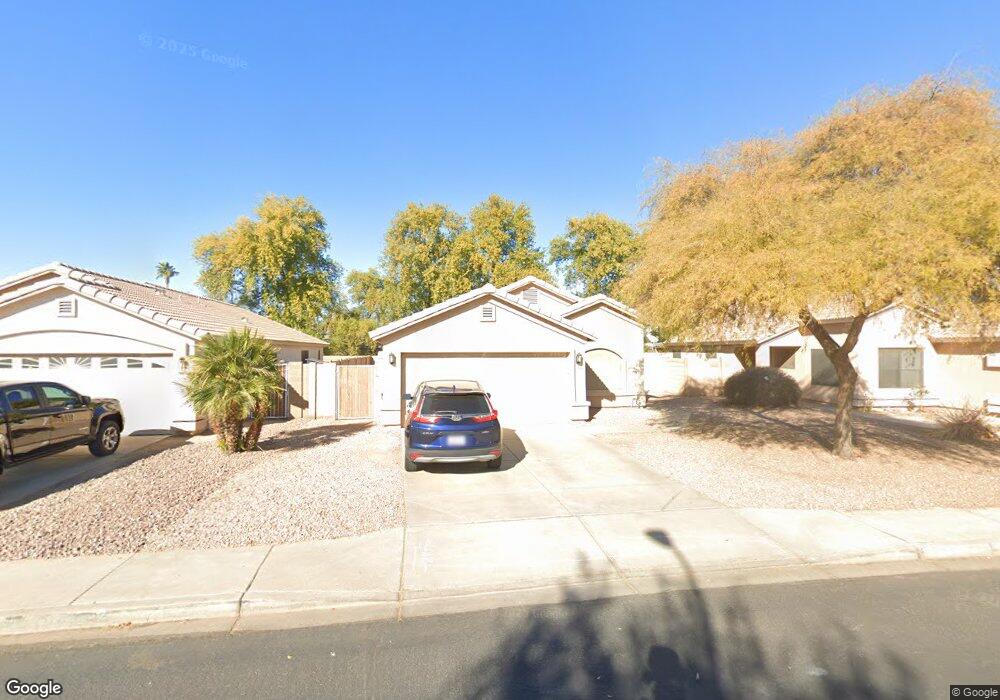
9430 W Cinnabar Ave Peoria, AZ 85345
Estimated Value: $302,696 - $426,000
--
Bed
2
Baths
1,591
Sq Ft
$242/Sq Ft
Est. Value
About This Home
This home is located at 9430 W Cinnabar Ave, Peoria, AZ 85345 and is currently estimated at $384,424, approximately $241 per square foot. 9430 W Cinnabar Ave is a home located in Maricopa County with nearby schools including Sun Valley Elementary School, Raymond S. Kellis, and Ombudsman - Northwest Charter.
Ownership History
Date
Name
Owned For
Owner Type
Purchase Details
Closed on
Sep 18, 2017
Sold by
Rosales Michelle Angela and Rosales Armando
Bought by
Rosales Michelle and Rosales Armando
Current Estimated Value
Home Financials for this Owner
Home Financials are based on the most recent Mortgage that was taken out on this home.
Original Mortgage
$66,000
Outstanding Balance
$55,115
Interest Rate
3.9%
Mortgage Type
New Conventional
Estimated Equity
$329,309
Purchase Details
Closed on
Aug 21, 2017
Sold by
Broyles Angelina F and Broyles David S
Bought by
Rosales Michelle Angela and Rosales Armando
Home Financials for this Owner
Home Financials are based on the most recent Mortgage that was taken out on this home.
Original Mortgage
$66,000
Outstanding Balance
$55,115
Interest Rate
3.9%
Mortgage Type
New Conventional
Estimated Equity
$329,309
Purchase Details
Closed on
Nov 2, 1998
Sold by
Richmond American Homes Of Arizona Inc
Bought by
Broyles Angelina F and Broyles David S
Home Financials for this Owner
Home Financials are based on the most recent Mortgage that was taken out on this home.
Original Mortgage
$116,388
Interest Rate
6.42%
Mortgage Type
VA
Create a Home Valuation Report for This Property
The Home Valuation Report is an in-depth analysis detailing your home's value as well as a comparison with similar homes in the area
Home Values in the Area
Average Home Value in this Area
Purchase History
| Date | Buyer | Sale Price | Title Company |
|---|---|---|---|
| Rosales Michelle | -- | Wfg National Title Insurance | |
| Rosales Michelle Angela | -- | None Available | |
| Broyles Angelina F | $116,388 | Fidelity Title |
Source: Public Records
Mortgage History
| Date | Status | Borrower | Loan Amount |
|---|---|---|---|
| Open | Rosales Michelle | $66,000 | |
| Previous Owner | Broyles Angelina F | $116,388 |
Source: Public Records
Tax History Compared to Growth
Tax History
| Year | Tax Paid | Tax Assessment Tax Assessment Total Assessment is a certain percentage of the fair market value that is determined by local assessors to be the total taxable value of land and additions on the property. | Land | Improvement |
|---|---|---|---|---|
| 2025 | $1,191 | $12,906 | -- | -- |
| 2024 | $1,183 | $12,292 | -- | -- |
| 2023 | $1,183 | $26,430 | $5,280 | $21,150 |
| 2022 | $1,160 | $20,230 | $4,040 | $16,190 |
| 2021 | $1,215 | $18,370 | $3,670 | $14,700 |
| 2020 | $1,222 | $17,220 | $3,440 | $13,780 |
| 2019 | $1,185 | $15,500 | $3,100 | $12,400 |
| 2018 | $1,150 | $14,310 | $2,860 | $11,450 |
| 2017 | $1,147 | $12,720 | $2,540 | $10,180 |
| 2016 | $1,134 | $12,130 | $2,420 | $9,710 |
| 2015 | $1,055 | $10,030 | $2,000 | $8,030 |
Source: Public Records
Map
Nearby Homes
- 10127 N 95th Dr Unit A
- 10226 N 93rd Dr
- 9616 W Mountain View Rd Unit A
- 9564 W Purdue Ave
- 10134 N 97th Ave Unit B
- 10245 N 93rd Dr
- 9243 W Brown St
- 9653 W Purdue Ave
- 10018 N 97th Dr Unit A
- 9627 W North Ln Unit B
- 9717 W Purdue Ave
- 9519 W Sunnyslope Ln
- 10201 N 99th Ave Unit 32A
- 10201 N 99th Ave Unit 46
- 10201 N 99th Ave Unit 44
- 10201 N 99th Ave Unit 97
- 10201 N 99th Ave Unit 34
- 10201 N 99th Ave Unit 28A
- 10201 N 99th Ave Unit 49
- 10201 N 99th Ave Unit 129E
- 9426 W Cinnabar Ave
- 9434 W Cinnabar Ave
- 9434 W Cinnabar Ave Unit pe
- 9422 W Cinnabar Ave
- 9418 W Cinnabar Ave
- 9429 W Cinnabar Ave
- 9425 W Cinnabar Ave
- 10017 N 94th Ln
- 9421 W Cinnabar Ave
- 10010 N 94th Ln
- 9414 W Cinnabar Ave
- 10012 N 94th Ln
- 10008 N 94th Ln
- 10014 N 94th Ln
- 9976 N 94th Ln
- 9417 W Cinnabar Ave
- 10019 N 94th Ln
- 10016 N 94th Ln
- 9969 N 94th Ln
- 9410 W Cinnabar Ave