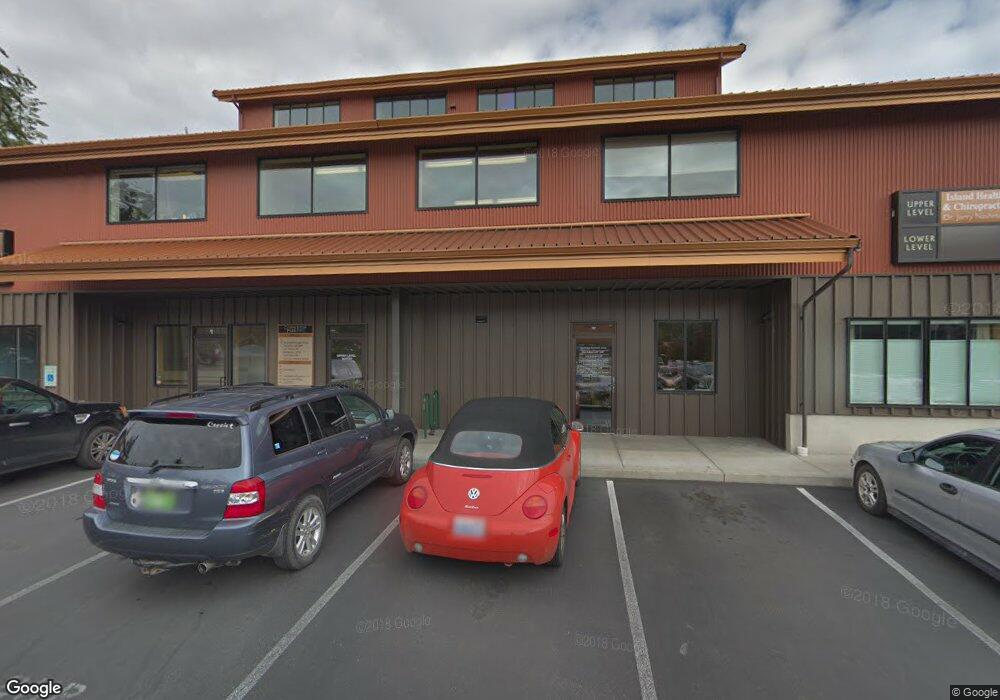
9431 Coppertop Loop NE Unit 102A Bainbridge Island, WA 98110
Estimated Value: $1,641,000 - $6,235,590
--
Bed
--
Bath
11,500
Sq Ft
$342/Sq Ft
Est. Value
About This Home
This home is located at 9431 Coppertop Loop NE Unit 102A, Bainbridge Island, WA 98110 and is currently estimated at $3,938,295, approximately $342 per square foot. 9431 Coppertop Loop NE Unit 102A is a home located in Kitsap County with nearby schools including Bainbridge High School, Montessori Country School, and St. Cecilia Catholic School.
Ownership History
Date
Name
Owned For
Owner Type
Purchase Details
Closed on
Jun 27, 2017
Sold by
Sp Phase I Llc
Bought by
Sportsman Park Llc
Current Estimated Value
Purchase Details
Closed on
Aug 30, 2007
Sold by
Sportsman Park Llc
Bought by
Sp Phase I Llc
Purchase Details
Closed on
Oct 12, 2006
Sold by
Pryor Antone and Pryor Young Oak
Bought by
Sportsman Park Llc
Purchase Details
Closed on
Jul 7, 2005
Sold by
Brown Richard C
Bought by
Pryor Antone and Pryor Young Oak
Create a Home Valuation Report for This Property
The Home Valuation Report is an in-depth analysis detailing your home's value as well as a comparison with similar homes in the area
Home Values in the Area
Average Home Value in this Area
Purchase History
| Date | Buyer | Sale Price | Title Company |
|---|---|---|---|
| Sportsman Park Llc | $281 | Attorneys Title Of Kitsap | |
| Sp Phase I Llc | -- | Transnation Title Ins Co | |
| Sportsman Park Llc | -- | Pacific Nw Title | |
| Pryor Antone | $1,270,280 | Pacific Nw Title |
Source: Public Records
Tax History Compared to Growth
Tax History
| Year | Tax Paid | Tax Assessment Tax Assessment Total Assessment is a certain percentage of the fair market value that is determined by local assessors to be the total taxable value of land and additions on the property. | Land | Improvement |
|---|---|---|---|---|
| 2026 | $17,895 | $2,209,710 | $543,050 | $1,666,660 |
| 2025 | $17,895 | $2,209,710 | $452,520 | $1,757,190 |
| 2024 | $17,101 | $2,209,710 | $348,110 | $1,861,600 |
| 2023 | $17,846 | $2,209,710 | $278,480 | $1,931,230 |
| 2022 | $18,181 | $1,921,740 | $278,480 | $1,643,260 |
| 2021 | $19,039 | $1,921,740 | $264,670 | $1,657,070 |
| 2020 | $18,060 | $1,795,920 | $253,160 | $1,542,760 |
| 2019 | $17,698 | $1,795,920 | $253,160 | $1,542,760 |
| 2018 | $16,648 | $1,506,330 | $252,090 | $1,254,240 |
| 2017 | $15,652 | $1,506,330 | $252,090 | $1,254,240 |
| 2016 | $16,552 | $1,515,090 | $267,070 | $1,248,020 |
| 2015 | $16,214 | $1,515,090 | $72,360 | $1,442,730 |
| 2014 | -- | $1,515,090 | $72,360 | $1,442,730 |
| 2013 | -- | $1,515,090 | $95,980 | $1,419,110 |
Source: Public Records
Map
Nearby Homes
- 9641 NE Northtown Loop
- 0 NE Lofgren (Lot A) Rd
- 0 NE New Brooklyn Rd Unit NWM2211912
- 9380 Ferncliff Ave NE
- 9705 NE Beach Crest Dr
- 9631 Summer Hill Ln NE
- 9820 NE Beach Crest Dr
- 8679 NE Fox Den Ln Unit Lot B
- 9418 NE Tidal Ct
- 9300 NE New Brooklyn Rd
- 300 High School Rd NE Unit 203
- 300 High School Rd NE Unit 419
- 1349 Nolta Loop NE
- 1351 Nolta Loop NE
- 1240 Weaver Rd NW Unit B1
- 11000 Xx State Hwy 305 NE
- 0 Sunrise Dr NE
- 1322 Polly's Ln
- 8128 High School Loop NE
- 171 Wallace Way NE Unit B
- 9431 Coppertop Loop NE Unit 201
- 9431 Coppertop Loop NE Unit 101
- 9431 Coppertop Loop NE Unit 102E
- 9431 Coppertop Loop NE Unit 102B
- 9431 Coppertop Loop NE
- 9437 Coppertop Loop NE
- 9419 Coppertop Loop NE
- 9416 9720 Coppertop Loop
- 9720 Coppertop Loop NE Unit 100
- 9720 Coppertop Loop NE Unit 203
- 9720 Coppertop Loop NE Unit 101
- 9720 Coppertop Loop NE Unit 102
- 9720 Coppertop Loop NE
- 9700 Coppertop Loop NE
- 9415 Coppertop Loop NE
- 9415 Coppertop Loop NE Unit 102
- 9415 Coppertop Loop NE Unit C
- 9727 Coppertop Loop NE Unit 200
- 9727 Coppertop Loop NE Unit 202
- 9727 Coppertop Loop NE Unit 201