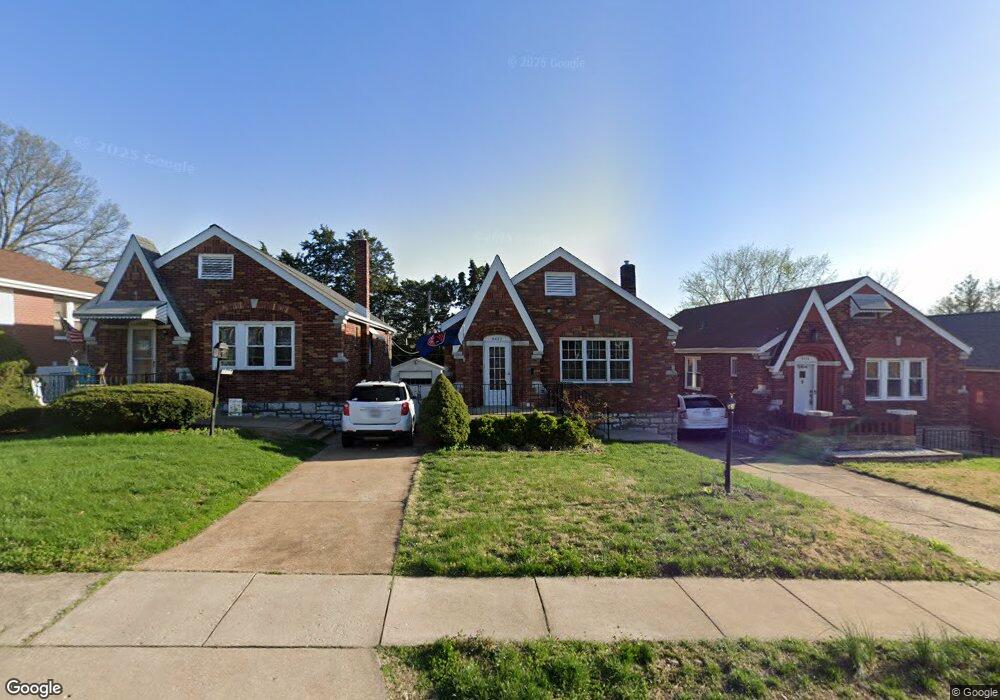
9432 Alpine Dr Saint Louis, MO 63123
Estimated Value: $234,000 - $259,000
2
Beds
2
Baths
1,212
Sq Ft
$203/Sq Ft
Est. Value
About This Home
This home is located at 9432 Alpine Dr, Saint Louis, MO 63123 and is currently estimated at $245,875, approximately $202 per square foot. 9432 Alpine Dr is a home located in St. Louis County with nearby schools including Mesnier Primary School, Gotsch Intermediate School, and Rogers Middle School.
Ownership History
Date
Name
Owned For
Owner Type
Purchase Details
Closed on
Apr 21, 2011
Sold by
Brinkman Priscilla P
Bought by
Brinkman Daniel P
Current Estimated Value
Home Financials for this Owner
Home Financials are based on the most recent Mortgage that was taken out on this home.
Original Mortgage
$133,281
Outstanding Balance
$85,224
Interest Rate
3.37%
Mortgage Type
FHA
Estimated Equity
$160,651
Purchase Details
Closed on
Aug 22, 2007
Sold by
Laury Priscilla P and Brinkman Daniel P
Bought by
Brinkman Priscilla P and Brinkman Daniel P
Purchase Details
Closed on
Apr 27, 2005
Sold by
Oberlander Devin A and Oberlander Andrea L
Bought by
Brinkman Daniel P and Laury Priscilla P
Home Financials for this Owner
Home Financials are based on the most recent Mortgage that was taken out on this home.
Original Mortgage
$154,635
Interest Rate
6.06%
Mortgage Type
FHA
Purchase Details
Closed on
May 5, 1997
Sold by
Oberlander Devin A and Oberlander Andrea L
Bought by
Oberlander Devin A and Oberlander Andrea L
Create a Home Valuation Report for This Property
The Home Valuation Report is an in-depth analysis detailing your home's value as well as a comparison with similar homes in the area
Home Values in the Area
Average Home Value in this Area
Purchase History
| Date | Buyer | Sale Price | Title Company |
|---|---|---|---|
| Brinkman Daniel P | -- | Pulaski Title Company | |
| Brinkman Priscilla P | -- | None Available | |
| Brinkman Daniel P | $156,000 | Fa | |
| Oberlander Devin A | -- | -- |
Source: Public Records
Mortgage History
| Date | Status | Borrower | Loan Amount |
|---|---|---|---|
| Open | Brinkman Daniel P | $133,281 | |
| Closed | Brinkman Daniel P | $154,635 |
Source: Public Records
Tax History Compared to Growth
Tax History
| Year | Tax Paid | Tax Assessment Tax Assessment Total Assessment is a certain percentage of the fair market value that is determined by local assessors to be the total taxable value of land and additions on the property. | Land | Improvement |
|---|---|---|---|---|
| 2025 | $3,220 | $43,700 | $12,460 | $31,240 |
| 2024 | $3,220 | $39,670 | $8,910 | $30,760 |
| 2023 | $3,220 | $39,670 | $8,910 | $30,760 |
| 2022 | $3,088 | $33,710 | $8,910 | $24,800 |
| 2021 | $2,818 | $33,710 | $8,910 | $24,800 |
| 2020 | $2,731 | $30,480 | $8,910 | $21,570 |
| 2019 | $2,726 | $30,480 | $8,910 | $21,570 |
| 2018 | $2,541 | $25,100 | $6,230 | $18,870 |
| 2017 | $2,526 | $25,100 | $6,230 | $18,870 |
| 2016 | $2,287 | $24,150 | $3,570 | $20,580 |
| 2015 | $2,297 | $24,150 | $3,570 | $20,580 |
| 2014 | -- | $22,490 | $4,520 | $17,970 |
Source: Public Records
Map
Nearby Homes
- 9409 Alpine Dr
- 9347 Mackenzie Rd
- 9313 Brenda Ave
- 9702 Sterling Place
- 9506 Sterling Place
- 9332 Cloverhurst Dr
- 9327 Cloverhurst Dr
- 9529 MacKenzie Circle Dr
- 9425 MacKenzie Circle Ct
- 9117 Tiber Ct
- 6426 Judson Ave
- 9108 Tiber Ct
- 9744 Bexley Station Dr Unit 8J
- 9740 Bexley Station Dr
- 9723 Crayford Rd Unit 1B
- 8740 Brenda Ave
- 9127 Coral Dr
- 6236 Bixby Ave
- 8942 Eden Ave
- 8736 New Hampshire Ave
- 9430 Alpine Dr
- 9436 Alpine Dr
- 9428 Alpine Dr
- 9438 Alpine Dr
- 9426 Alpine Dr
- 9429 Talbot Dr
- 9425 Talbot Dr
- 9352 Rambler Dr
- 9500 Alpine Dr
- 9437 Talbot Dr
- 9417 Talbot Dr
- 9350 Rambler Dr
- 9502 Alpine Dr
- 9424 Alpine Dr
- 9348 Rambler Dr
- 9427 Alpine Dr
- 9506 Alpine Dr
- 9501 Evandale Dr
- 9346 Rambler Dr
- 9345 Rambler Dr