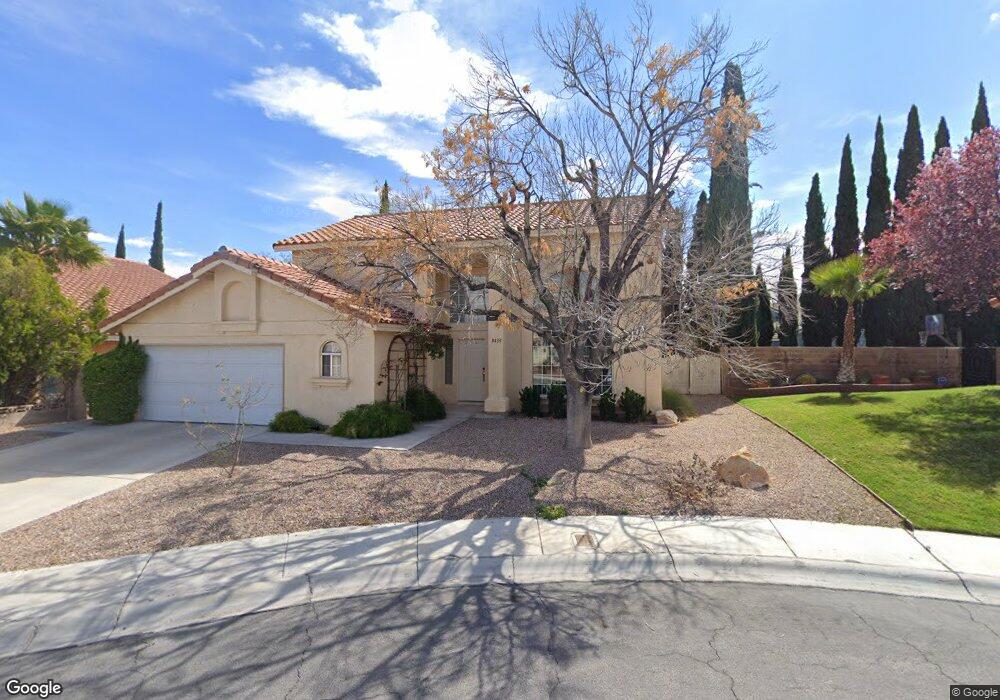
9433 Whittier Ct Las Vegas, NV 89117
The Section Seven NeighborhoodEstimated Value: $556,012 - $626,000
4
Beds
3
Baths
2,200
Sq Ft
$269/Sq Ft
Est. Value
About This Home
This home is located at 9433 Whittier Ct, Las Vegas, NV 89117 and is currently estimated at $591,753, approximately $268 per square foot. 9433 Whittier Ct is a home located in Clark County with nearby schools including M J Christensen Elementary School, Clifford J Lawrence Junior High School, and Bonanza High School.
Ownership History
Date
Name
Owned For
Owner Type
Purchase Details
Closed on
Jun 2, 1994
Sold by
Watkins Jon M and Watkins Valerie J
Bought by
Peterson Kenneth E and Peterson Susan S
Current Estimated Value
Home Financials for this Owner
Home Financials are based on the most recent Mortgage that was taken out on this home.
Original Mortgage
$87,950
Interest Rate
8.83%
Create a Home Valuation Report for This Property
The Home Valuation Report is an in-depth analysis detailing your home's value as well as a comparison with similar homes in the area
Home Values in the Area
Average Home Value in this Area
Purchase History
| Date | Buyer | Sale Price | Title Company |
|---|---|---|---|
| Peterson Kenneth E | $163,000 | United Title |
Source: Public Records
Mortgage History
| Date | Status | Borrower | Loan Amount |
|---|---|---|---|
| Previous Owner | Peterson Kenneth E | $87,950 |
Source: Public Records
Tax History Compared to Growth
Tax History
| Year | Tax Paid | Tax Assessment Tax Assessment Total Assessment is a certain percentage of the fair market value that is determined by local assessors to be the total taxable value of land and additions on the property. | Land | Improvement |
|---|---|---|---|---|
| 2025 | $2,307 | $115,609 | $57,050 | $58,559 |
| 2024 | $2,240 | $115,609 | $57,050 | $58,559 |
| 2023 | $1,828 | $103,791 | $47,250 | $56,541 |
| 2022 | $2,175 | $88,862 | $36,750 | $52,112 |
| 2021 | $2,112 | $86,211 | $36,400 | $49,811 |
| 2020 | $2,047 | $82,666 | $32,900 | $49,766 |
| 2019 | $1,988 | $76,328 | $26,950 | $49,378 |
| 2018 | $1,930 | $74,384 | $26,600 | $47,784 |
| 2017 | $2,415 | $73,643 | $24,850 | $48,793 |
| 2016 | $1,828 | $66,696 | $17,500 | $49,196 |
| 2015 | $1,824 | $58,422 | $16,450 | $41,972 |
| 2014 | $1,770 | $52,389 | $8,750 | $43,639 |
Source: Public Records
Map
Nearby Homes
- 9429 Abalone Way
- 3009 Periscope Ct
- 2913 Domino Way
- 9113 Anchor Cove Ct
- 3040 Ocean Port Dr
- 9504 Cliff View Way
- 9544 Lazy River Dr
- 9100 Shelter Cove Ct
- 9548 Wooden Pier Way
- 9605 Blowing Sand Cir
- 9713 Cascade Falls Ave
- 9312 Angelfish Dr
- 2712 Quail Roost Way
- 9708 Blazing Star Ct
- 9624 Beach Water Cir
- 9724 Cascade Falls Ave
- 2728 Monrovia Dr
- 2724 Monrovia Dr
- 3001 Bridge Creek St
- 9021 Feather River Ct
- 9429 Whittier Ct
- 9437 Whittier Ct Unit 10B
- 9432 Darwell Dr Unit 10B
- 9428 Darwell Dr
- 9425 Whittier Ct
- 9440 Whittier Ct
- 9432 Whittier Ct
- 9428 Whittier Ct
- 9424 Darwell Dr
- 9436 Whittier Ct
- 9424 Whittier Ct
- 9440 Darwell Dr
- 2932 Channel Rock Dr
- 2932 Channel Rock Dr
- 2928 Channel Rock Dr
- 2936 Channel Rock Dr
- 9433 Abalone Way
- 2928 Charring Cross Way
- 2932 Charring Cross Way
- 9433 Darwell Dr