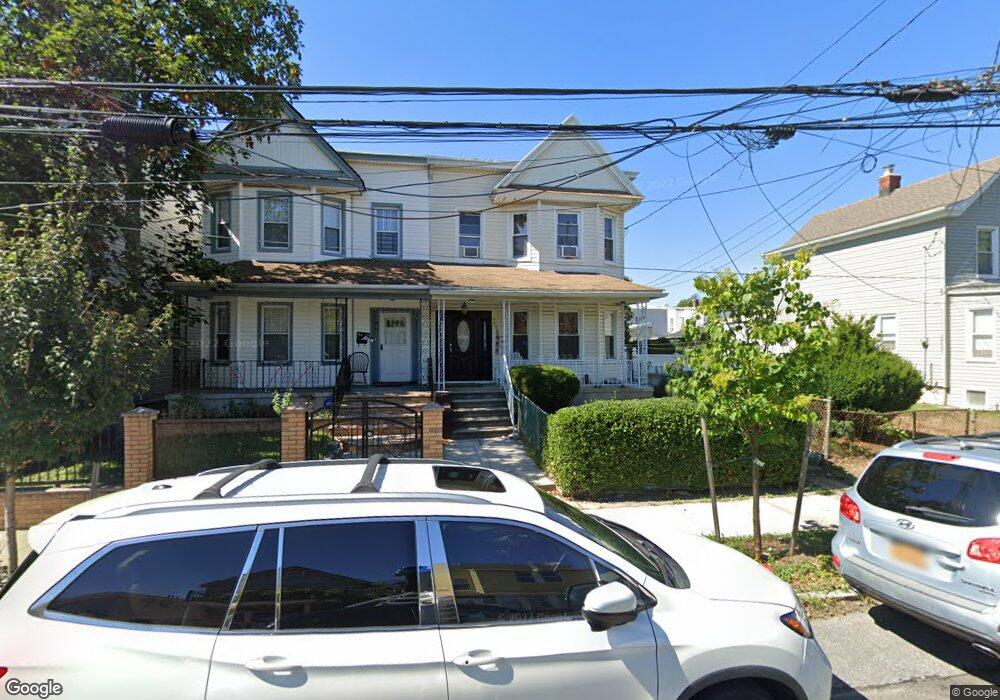
9434 110th St South Richmond Hill, NY 11419
Richmond Hill NeighborhoodEstimated Value: $629,167 - $757,000
--
Bed
--
Bath
1,158
Sq Ft
$600/Sq Ft
Est. Value
About This Home
This home is located at 9434 110th St, South Richmond Hill, NY 11419 and is currently estimated at $694,292, approximately $599 per square foot. 9434 110th St is a home located in Queens County with nearby schools including P.S. 90 - Horace Mann, M.S.137 America's School of Heroes, and Richmond Hill High School.
Ownership History
Date
Name
Owned For
Owner Type
Purchase Details
Closed on
Jun 2, 2006
Sold by
Quinn Timothy P
Bought by
Ospino Gloria and Ospino Roberto
Current Estimated Value
Home Financials for this Owner
Home Financials are based on the most recent Mortgage that was taken out on this home.
Original Mortgage
$372,600
Outstanding Balance
$219,671
Interest Rate
6.62%
Mortgage Type
Purchase Money Mortgage
Estimated Equity
$474,621
Purchase Details
Closed on
Jan 24, 2000
Sold by
Cosides Kathleen Holmes and Marino Mariann
Bought by
Quinn Timothy P
Home Financials for this Owner
Home Financials are based on the most recent Mortgage that was taken out on this home.
Original Mortgage
$163,100
Interest Rate
8.15%
Mortgage Type
FHA
Create a Home Valuation Report for This Property
The Home Valuation Report is an in-depth analysis detailing your home's value as well as a comparison with similar homes in the area
Home Values in the Area
Average Home Value in this Area
Purchase History
| Date | Buyer | Sale Price | Title Company |
|---|---|---|---|
| Ospino Gloria | $414,000 | -- | |
| Quinn Timothy P | $164,500 | -- |
Source: Public Records
Mortgage History
| Date | Status | Borrower | Loan Amount |
|---|---|---|---|
| Open | Ospino Gloria | $372,600 | |
| Previous Owner | Quinn Timothy P | $163,100 |
Source: Public Records
Tax History Compared to Growth
Tax History
| Year | Tax Paid | Tax Assessment Tax Assessment Total Assessment is a certain percentage of the fair market value that is determined by local assessors to be the total taxable value of land and additions on the property. | Land | Improvement |
|---|---|---|---|---|
| 2025 | $6,019 | $31,530 | $10,298 | $21,232 |
| 2024 | $6,019 | $29,966 | $11,251 | $18,715 |
| 2023 | $5,678 | $28,272 | $9,976 | $18,296 |
| 2022 | $5,325 | $32,040 | $12,660 | $19,380 |
| 2021 | $5,613 | $33,120 | $12,660 | $20,460 |
| 2020 | $5,562 | $31,080 | $12,660 | $18,420 |
| 2019 | $5,224 | $30,600 | $12,660 | $17,940 |
| 2018 | $4,803 | $23,560 | $10,807 | $12,753 |
| 2017 | $4,531 | $22,227 | $11,467 | $10,760 |
| 2016 | $4,443 | $22,227 | $11,467 | $10,760 |
| 2015 | $2,309 | $21,896 | $10,925 | $10,971 |
| 2014 | $2,309 | $20,810 | $11,118 | $9,692 |
Source: Public Records
Map
Nearby Homes