Estimated Value: $583,000 - $667,000
--
Bed
5
Baths
3,270
Sq Ft
$188/Sq Ft
Est. Value
About This Home
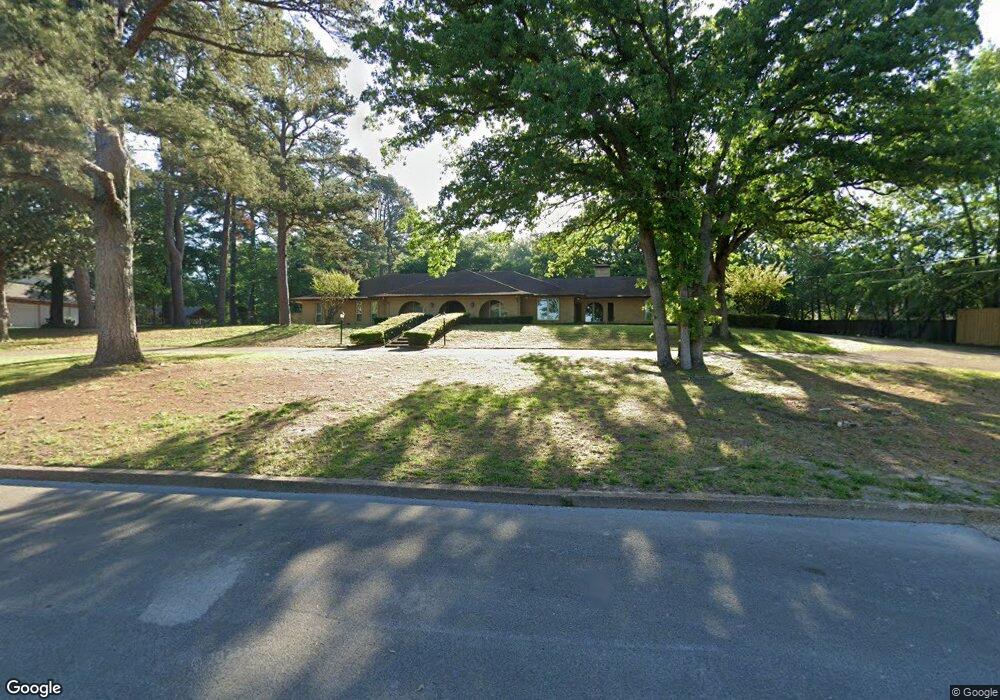
This home is located at 9438 9438 Cherokee Trail, Tyler, TX 75703 and is currently estimated at $613,221, approximately $187 per square foot. 9438 9438 Cherokee Trail is a home located in Smith County with nearby schools including Dr. Bryan C. Jack Elementary School, Hubbard Middle School, and Tyler Legacy High School.
Ownership History
Date
Name
Owned For
Owner Type
Purchase Details
Closed on
Oct 14, 2014
Sold by
Bush Robert L and Bush Erin L
Bought by
Mcneil Steven
Current Estimated Value
Home Financials for this Owner
Home Financials are based on the most recent Mortgage that was taken out on this home.
Original Mortgage
$280,000
Outstanding Balance
$215,555
Interest Rate
4.37%
Mortgage Type
Adjustable Rate Mortgage/ARM
Estimated Equity
$397,666
Purchase Details
Closed on
Feb 18, 2011
Sold by
Fannie Mae
Bought by
Bush Robert L and Bush Erin L
Home Financials for this Owner
Home Financials are based on the most recent Mortgage that was taken out on this home.
Original Mortgage
$258,070
Interest Rate
4.7%
Mortgage Type
New Conventional
Create a Home Valuation Report for This Property
The Home Valuation Report is an in-depth analysis detailing your home's value as well as a comparison with similar homes in the area
Home Values in the Area
Average Home Value in this Area
Purchase History
| Date | Buyer | Sale Price | Title Company |
|---|---|---|---|
| Mcneil Steven | -- | None Available | |
| Bush Robert L | -- | Central Title Company | |
| Bush Robert L | -- | Central Title Company |
Source: Public Records
Mortgage History
| Date | Status | Borrower | Loan Amount |
|---|---|---|---|
| Open | Mcneil Steven | $280,000 | |
| Previous Owner | Bush Robert L | $258,070 |
Source: Public Records
Tax History Compared to Growth
Tax History
| Year | Tax Paid | Tax Assessment Tax Assessment Total Assessment is a certain percentage of the fair market value that is determined by local assessors to be the total taxable value of land and additions on the property. | Land | Improvement |
|---|---|---|---|---|
| 2025 | $9,448 | $634,617 | $173,076 | $461,541 |
| 2024 | $9,448 | $555,348 | $82,320 | $473,028 |
| 2023 | $8,912 | $511,266 | $82,320 | $428,946 |
| 2022 | $8,913 | $454,929 | $61,740 | $393,189 |
| 2021 | $8,738 | $416,471 | $61,740 | $354,731 |
| 2020 | $8,162 | $381,410 | $58,859 | $322,551 |
| 2019 | $7,995 | $365,616 | $58,859 | $306,757 |
| 2018 | $7,567 | $347,917 | $41,160 | $306,757 |
| 2017 | $7,428 | $347,917 | $41,160 | $306,757 |
| 2016 | $7,657 | $358,635 | $41,160 | $317,475 |
| 2015 | $6,838 | $342,869 | $41,160 | $301,709 |
| 2014 | $6,838 | $334,956 | $41,160 | $293,796 |
Source: Public Records
Map
Nearby Homes
- 1242 Rainmaker
- 1261 Luann Ln
- 1242 Colt Ln
- 1266 Santa fe Trail
- 1211 Centennial Trail
- 9211 Elm Tree Cir
- 629 Winding Brook Ln
- 1625 Skidmore Ln
- 9214 Stonebank Crossing
- 1633 Legacy Ct
- 533 Skipping Stone Ln
- 533 Stepping Stone Ln
- 8811 Wilder Trail
- 8831 Wilder Trail
- 8714 Wilder Trail
- 8702 Wilder Trail
- 8741 Wilder Trail
- 8810 Wilder Trail
- 9256 Villas Ct
- 9231 Villas Ct
- 9438 Cherokee Trail
- 1211 DreaMcAtcher
- 1219 Dreamcatcher
- 1203 DreaMcAtcher
- 1203 1203 DreaMcAtcher
- 9432 9432 Cherokee Trail
- 9432 Cherokee Trail
- 9433 9433 Cherokee Trail
- 1227 Dreamcatcher
- Lot 31 Dreamcatcher
- 9433 Cherokee Trail
- 9437 9437 Cherokee Trail
- 1218 Dreamcatcher
- 1210 DreaMcAtcher
- 1210 (Lot 26) Dreamcatcher
- 1210 1210 DreaMcAtcher
- 9387 Chisholm Trail
- 9375 9375 Chisholm Trail
- 1226 Dreamcatcher
- 1242 DreaMcAtcher