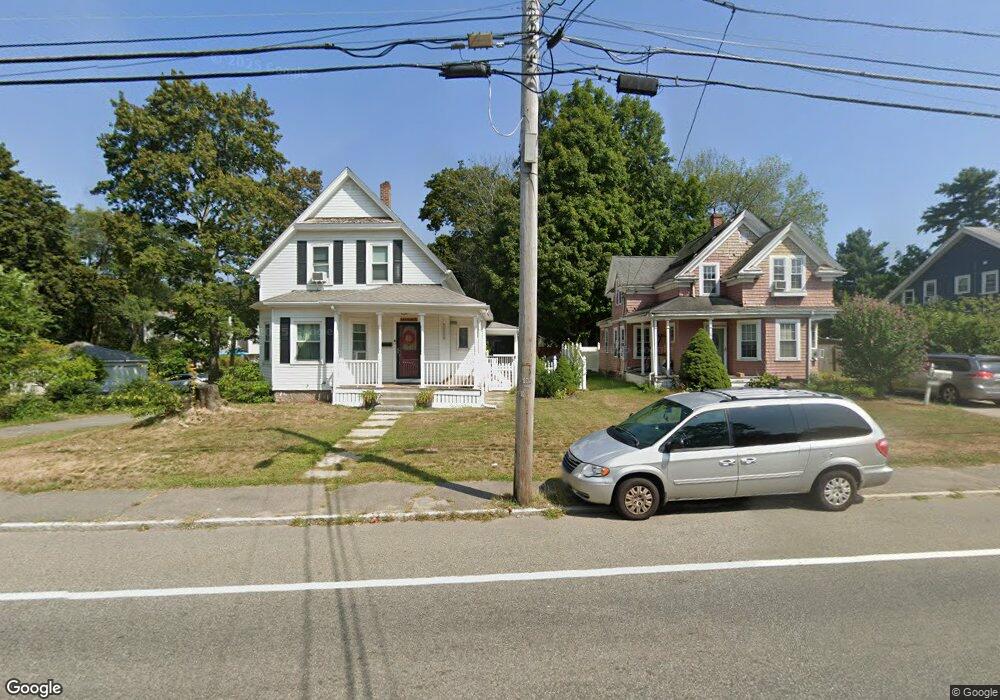
943R S Franklin St Holbrook, MA 02343
Estimated Value: $493,980 - $531,000
4
Beds
1
Bath
1,104
Sq Ft
$466/Sq Ft
Est. Value
About This Home
This home is located at 943R S Franklin St, Holbrook, MA 02343 and is currently estimated at $513,993, approximately $465 per square foot. 943R S Franklin St is a home located in Norfolk County with nearby schools including John F. Kennedy Elementary School, Holbrook Middle High School, and Boston Higashi School.
Ownership History
Date
Name
Owned For
Owner Type
Purchase Details
Closed on
May 30, 2001
Sold by
Smith Donald P
Bought by
Roberts Douglas
Current Estimated Value
Home Financials for this Owner
Home Financials are based on the most recent Mortgage that was taken out on this home.
Original Mortgage
$149,816
Outstanding Balance
$55,516
Interest Rate
7.09%
Mortgage Type
Purchase Money Mortgage
Estimated Equity
$458,477
Create a Home Valuation Report for This Property
The Home Valuation Report is an in-depth analysis detailing your home's value as well as a comparison with similar homes in the area
Home Values in the Area
Average Home Value in this Area
Purchase History
| Date | Buyer | Sale Price | Title Company |
|---|---|---|---|
| Roberts Douglas | $151,000 | -- |
Source: Public Records
Mortgage History
| Date | Status | Borrower | Loan Amount |
|---|---|---|---|
| Open | Roberts Douglas | $149,816 |
Source: Public Records
Tax History Compared to Growth
Tax History
| Year | Tax Paid | Tax Assessment Tax Assessment Total Assessment is a certain percentage of the fair market value that is determined by local assessors to be the total taxable value of land and additions on the property. | Land | Improvement |
|---|---|---|---|---|
| 2025 | $5,285 | $401,000 | $177,600 | $223,400 |
| 2024 | $5,056 | $376,200 | $171,100 | $205,100 |
| 2023 | $5,329 | $346,500 | $152,600 | $193,900 |
| 2022 | $5,066 | $307,200 | $135,800 | $171,400 |
| 2021 | $4,966 | $288,400 | $126,900 | $161,500 |
| 2020 | $5,030 | $273,800 | $118,600 | $155,200 |
| 2019 | $5,198 | $267,100 | $118,500 | $148,600 |
| 2018 | $5,081 | $245,800 | $102,200 | $143,600 |
| 2017 | $4,422 | $211,600 | $93,100 | $118,500 |
| 2016 | $3,755 | $191,200 | $84,900 | $106,300 |
| 2015 | -- | $188,700 | $86,700 | $102,000 |
| 2014 | $3,285 | $175,000 | $73,000 | $102,000 |
Source: Public Records
Map
Nearby Homes
- 5 Brookville Ave
- 38 Stephen Dr
- 12 Hamilton Way
- 261 Jon Dr
- 18 Brookfield Dr
- 719 S Franklin St Unit L Block 1
- 719 S Franklin St Unit D Block 1
- 719 S Franklin St Unit C Block 1
- 285 Hovendon Ave
- 170 Elsie Rd
- 690 N Quincy St
- 29 Belair Dr
- 68 Spring St
- 60 Bonney St
- 28 Border Rd
- 55 Border Rd
- 279 Howard St
- 105 Oscar Ave
- 61 Kent St
- 63 Juniper Rd
- 943-R S Franklin St
- 943 S Franklin St Unit R
- 945 S Franklin St
- 11 Emery St
- 30 Emery St
- 955 S Franklin St
- 15 Woodlawn Ave
- 1 Woodlawn Ave
- 957 S Franklin St
- 929 S Franklin St
- 948 S Franklin St
- 25 Emery St
- 31 Emery St
- 17 Woodlawn Ave
- 35 Emery St
- 963 S Franklin St
- 19 Emery St
- 19 Woodlawn Ave
- 4 West St
- 960 S Franklin St