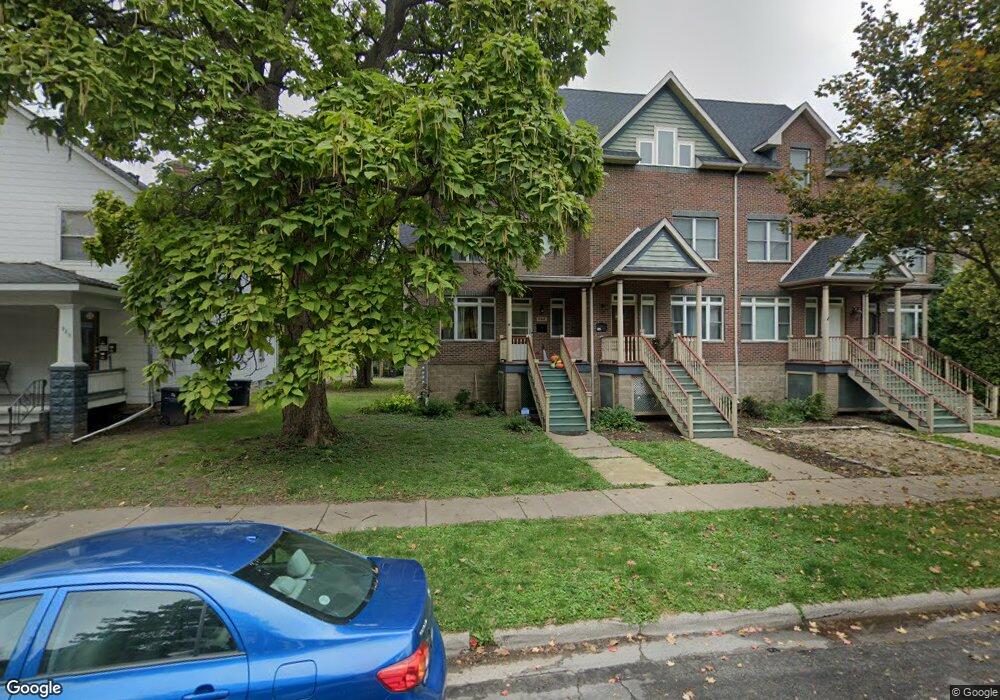
944 22nd St Unit A Rock Island, IL 61201
Broadway NeighborhoodEstimated Value: $128,000 - $135,507
3
Beds
2
Baths
1,677
Sq Ft
$79/Sq Ft
Est. Value
About This Home
This home is located at 944 22nd St Unit A, Rock Island, IL 61201 and is currently estimated at $131,877, approximately $78 per square foot. 944 22nd St Unit A is a home located in Rock Island County with nearby schools including Rock Island Academy, Washington Junior High School, and Rock Island High School.
Ownership History
Date
Name
Owned For
Owner Type
Purchase Details
Closed on
Apr 18, 2025
Sold by
Jones Charles A
Bought by
Ruffner Jeffrey
Current Estimated Value
Home Financials for this Owner
Home Financials are based on the most recent Mortgage that was taken out on this home.
Original Mortgage
$26,000
Outstanding Balance
$13,068
Interest Rate
2.5%
Mortgage Type
New Conventional
Estimated Equity
$118,809
Purchase Details
Closed on
Aug 19, 2020
Sold by
Boyd Shawn D
Bought by
Jones Charles A
Purchase Details
Closed on
Jul 5, 2018
Sold by
Cathy Boyd
Bought by
Boyd Shawn
Create a Home Valuation Report for This Property
The Home Valuation Report is an in-depth analysis detailing your home's value as well as a comparison with similar homes in the area
Home Values in the Area
Average Home Value in this Area
Purchase History
| Date | Buyer | Sale Price | Title Company |
|---|---|---|---|
| Ruffner Jeffrey | $130,000 | None Listed On Document | |
| Jones Charles A | $94,000 | Gomez Title | |
| Boyd Shawn | -- | Puryear Law Pc |
Source: Public Records
Mortgage History
| Date | Status | Borrower | Loan Amount |
|---|---|---|---|
| Open | Ruffner Jeffrey | $26,000 | |
| Open | Ruffner Jeffrey | $104,000 |
Source: Public Records
Tax History Compared to Growth
Tax History
| Year | Tax Paid | Tax Assessment Tax Assessment Total Assessment is a certain percentage of the fair market value that is determined by local assessors to be the total taxable value of land and additions on the property. | Land | Improvement |
|---|---|---|---|---|
| 2024 | $3,193 | $37,300 | $2,113 | $35,187 |
| 2023 | $3,193 | $35,591 | $2,016 | $33,575 |
| 2022 | $2,744 | $32,447 | $1,893 | $30,554 |
| 2021 | $2,691 | $31,139 | $1,817 | $29,322 |
| 2020 | $2,641 | $30,380 | $1,773 | $28,607 |
| 2019 | $3,258 | $30,380 | $1,773 | $28,607 |
| 2018 | $3,258 | $36,682 | $1,773 | $34,909 |
| 2017 | $3,146 | $36,140 | $1,747 | $34,393 |
| 2016 | $3,022 | $35,432 | $1,713 | $33,719 |
| 2015 | $2,865 | $33,585 | $1,624 | $31,961 |
| 2014 | $769 | $33,771 | $1,633 | $32,138 |
| 2013 | $769 | $33,771 | $1,633 | $32,138 |
Source: Public Records
Map
Nearby Homes
- 1037 22nd St
- 1030 23rd St
- 1215-1215 1/2 20th St
- 1043 19th St
- 728 21st St
- 1200 25th St
- 1900 13th Ave
- 903 17th St
- 1018 17th St Unit 1
- 1008 16th St
- 1525 25th St
- 1635 20th St
- 718 17th St
- 550 26th St
- 2621 5 1 2 Ave
- 1620 18th Ave Unit 26
- 2833 8th Ave
- 1045 12th St Unit 1047
- 1628 18th Ave Unit 10
- 1632 18th Ave Unit 24