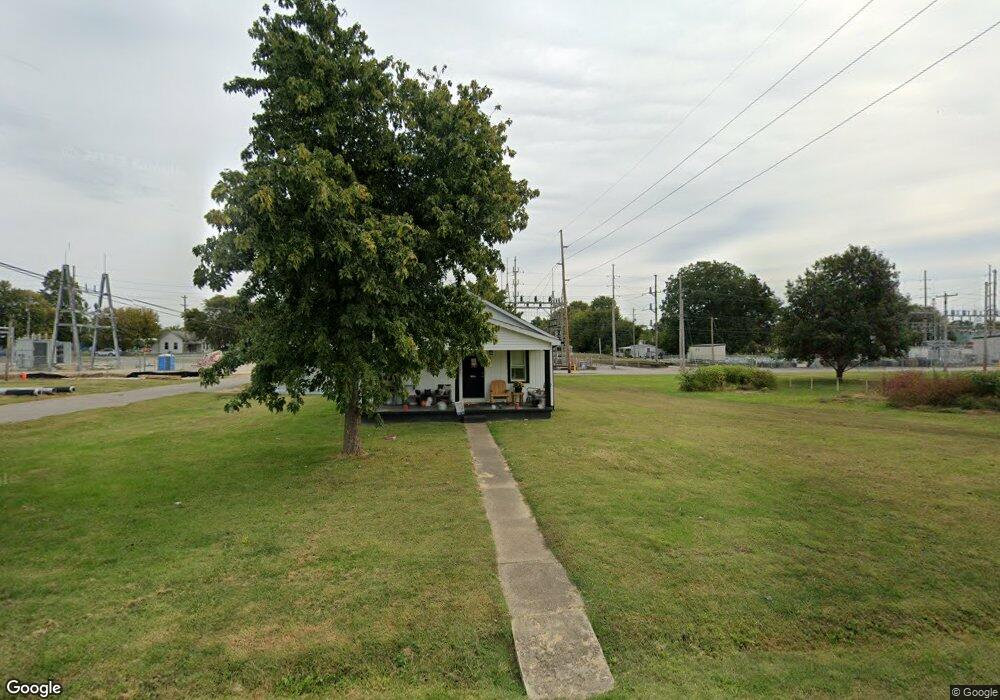
944 4th St Tell City, IN 47586
Estimated Value: $79,000 - $166,461
2
Beds
2
Baths
1,092
Sq Ft
$115/Sq Ft
Est. Value
About This Home
This home is located at 944 4th St, Tell City, IN 47586 and is currently estimated at $126,115, approximately $115 per square foot. 944 4th St is a home located in Perry County with nearby schools including William Tell Elementary School, Tell City Junior/Senior High School, and Agape Christian Academy.
Ownership History
Date
Name
Owned For
Owner Type
Purchase Details
Closed on
Feb 24, 2023
Sold by
Habitat For Humanity
Bought by
Jones Lacy
Current Estimated Value
Home Financials for this Owner
Home Financials are based on the most recent Mortgage that was taken out on this home.
Original Mortgage
$151,900
Outstanding Balance
$147,300
Interest Rate
6.33%
Mortgage Type
New Conventional
Estimated Equity
-$21,185
Purchase Details
Closed on
Mar 22, 2021
Sold by
Oost Barbara and Estate Of Lather V Oost
Bought by
Perry County Indiana Habitat
Create a Home Valuation Report for This Property
The Home Valuation Report is an in-depth analysis detailing your home's value as well as a comparison with similar homes in the area
Home Values in the Area
Average Home Value in this Area
Purchase History
| Date | Buyer | Sale Price | Title Company |
|---|---|---|---|
| Jones Lacy | $152,000 | -- | |
| Perry County Indiana Habitat | $30,000 | None Available |
Source: Public Records
Mortgage History
| Date | Status | Borrower | Loan Amount |
|---|---|---|---|
| Open | Jones Lacy | $151,900 |
Source: Public Records
Tax History Compared to Growth
Tax History
| Year | Tax Paid | Tax Assessment Tax Assessment Total Assessment is a certain percentage of the fair market value that is determined by local assessors to be the total taxable value of land and additions on the property. | Land | Improvement |
|---|---|---|---|---|
| 2024 | $636 | $81,500 | $16,200 | $65,300 |
| 2023 | $602 | $77,200 | $16,200 | $61,000 |
| 2022 | $462 | $56,000 | $16,200 | $39,800 |
| 2021 | $518 | $53,900 | $16,200 | $37,700 |
| 2020 | $522 | $52,300 | $16,300 | $36,000 |
| 2019 | $501 | $49,400 | $15,700 | $33,700 |
| 2018 | $509 | $49,300 | $15,600 | $33,700 |
| 2017 | $500 | $48,300 | $15,600 | $32,700 |
| 2016 | $508 | $48,400 | $15,600 | $32,800 |
| 2014 | $553 | $50,000 | $15,600 | $34,400 |
| 2013 | $553 | $49,000 | $15,500 | $33,500 |
Source: Public Records
Map
Nearby Homes