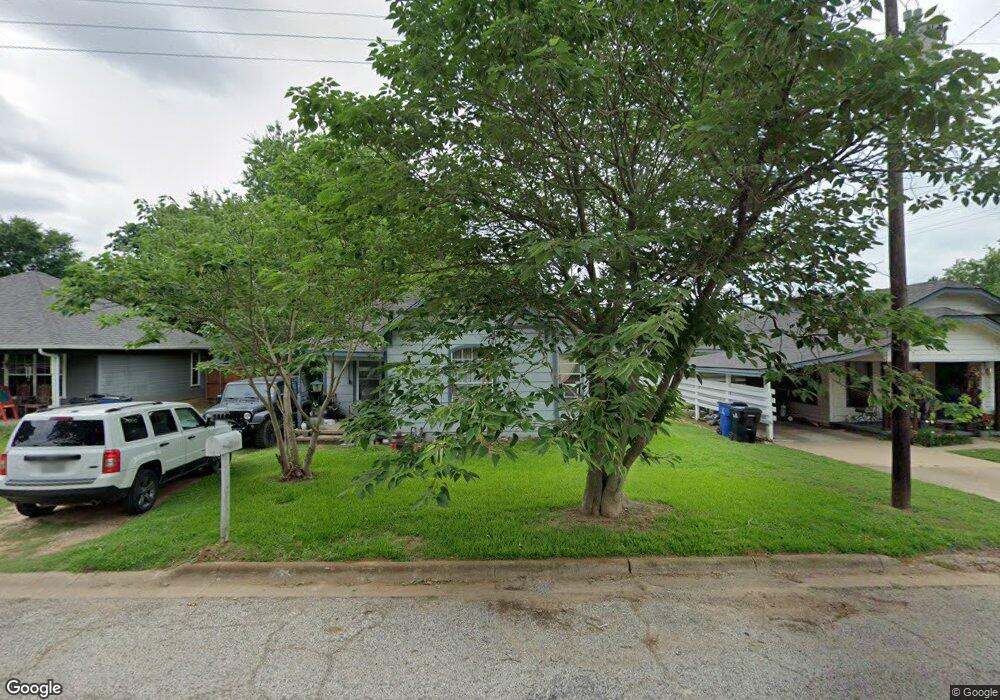
944 Chase St Denison, TX 75020
Estimated Value: $133,117 - $206,000
Studio
--
Bath
1,027
Sq Ft
$165/Sq Ft
Est. Value
About This Home
This home is located at 944 Chase St, Denison, TX 75020 and is currently estimated at $169,559, approximately $165 per square foot. 944 Chase St is a home located in Grayson County with nearby schools including Scott Middle School, Denison High School, and St. Luke's Parish Day School.
Ownership History
Date
Name
Owned For
Owner Type
Purchase Details
Closed on
Sep 20, 2019
Sold by
Wright Homer
Bought by
Ditto Lee
Current Estimated Value
Home Financials for this Owner
Home Financials are based on the most recent Mortgage that was taken out on this home.
Original Mortgage
$25,000
Outstanding Balance
$21,898
Interest Rate
3.6%
Mortgage Type
Seller Take Back
Estimated Equity
$147,661
Purchase Details
Closed on
Jul 27, 2011
Sold by
Wright Matthew L
Bought by
Wright Homer
Purchase Details
Closed on
Mar 24, 2005
Sold by
Aleman Anthony and Aleman Christina
Bought by
Wright Matthew L
Home Financials for this Owner
Home Financials are based on the most recent Mortgage that was taken out on this home.
Original Mortgage
$47,910
Interest Rate
5.67%
Mortgage Type
FHA
Purchase Details
Closed on
Mar 18, 2004
Sold by
Walker Larna Dee
Bought by
Aleman Anthony and Aleman Christina
Create a Home Valuation Report for This Property
The Home Valuation Report is an in-depth analysis detailing your home's value as well as a comparison with similar homes in the area
Home Values in the Area
Average Home Value in this Area
Purchase History
| Date | Buyer | Sale Price | Title Company |
|---|---|---|---|
| Ditto Lee | -- | None Available | |
| Wright Homer | -- | None Available | |
| Wright Matthew L | -- | -- | |
| Aleman Anthony | -- | -- |
Source: Public Records
Mortgage History
| Date | Status | Borrower | Loan Amount |
|---|---|---|---|
| Open | Ditto Lee | $25,000 | |
| Previous Owner | Wright Matthew L | $47,910 |
Source: Public Records
Tax History
| Year | Tax Paid | Tax Assessment Tax Assessment Total Assessment is a certain percentage of the fair market value that is determined by local assessors to be the total taxable value of land and additions on the property. | Land | Improvement |
|---|---|---|---|---|
| 2025 | $2,115 | $94,207 | $40,016 | $54,191 |
| 2024 | $2,115 | $91,053 | $36,670 | $54,383 |
| 2023 | $1,980 | $87,413 | $35,293 | $52,120 |
| 2022 | $2,005 | $84,399 | $35,293 | $49,106 |
| 2021 | $1,346 | $53,372 | $13,120 | $40,252 |
| 2020 | $1,373 | $52,068 | $9,840 | $42,228 |
| 2019 | $1,454 | $52,843 | $9,840 | $43,003 |
| 2018 | $1,623 | $58,512 | $5,904 | $52,608 |
| 2017 | $1,455 | $52,007 | $3,280 | $48,727 |
| 2016 | $1,285 | $45,944 | $3,280 | $42,664 |
| 2015 | $1,068 | $37,801 | $3,280 | $34,521 |
| 2014 | $1,022 | $36,161 | $1,640 | $34,521 |
Source: Public Records
Map
Nearby Homes
- 928 W Chase St
- 933 Rice St
- 1020 Rice St
- 929 W Collins St
- 1901 Woodlawn Blvd
- 736 W Bullock St
- 732 W Bullock St
- 916 W Collins St
- 2560 S Scullin Ave
- 1830 Clark Dr
- 1500 S Scullin Ave
- 217 W Acheson St
- 528 W Florence St
- 709 W Hanna St
- 614 Rice St
- 0 S Maurice Ave
- 603 W Star St
- 516 W Florence St
- 513 W Coffin St
- 508 W Florence St
Your Personal Tour Guide
Ask me questions while you tour the home.