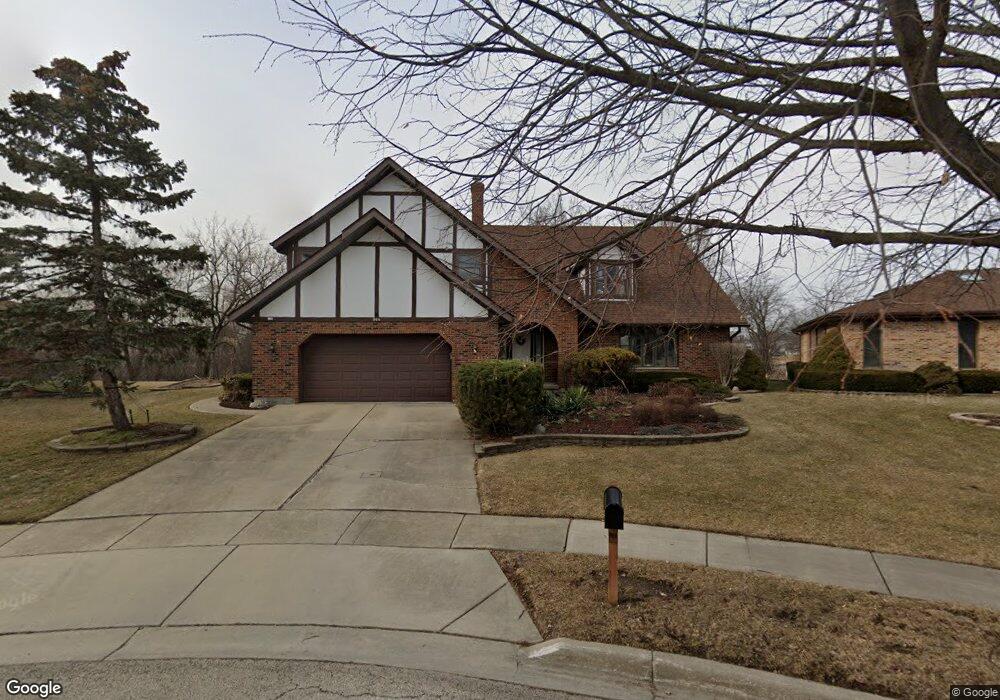
944 N Dexter Ln Hoffman Estates, IL 60169
South Hoffman Estates NeighborhoodEstimated Value: $547,000 - $607,000
4
Beds
3
Baths
2,445
Sq Ft
$236/Sq Ft
Est. Value
About This Home
This home is located at 944 N Dexter Ln, Hoffman Estates, IL 60169 and is currently estimated at $577,777, approximately $236 per square foot. 944 N Dexter Ln is a home located in Cook County with nearby schools including Hoover Math And Science Academy, Dwight D Eisenhower Junior High School, and Hoffman Estates High School.
Ownership History
Date
Name
Owned For
Owner Type
Purchase Details
Closed on
Jul 6, 2010
Sold by
Kim Ki Ja
Bought by
Kim Ki Ja and The Ki Ja Kim Declaration Of Trust
Current Estimated Value
Purchase Details
Closed on
Oct 12, 2006
Sold by
Kim Ki Ja
Bought by
Kim Ki Ja and Kim Kuk Tai
Purchase Details
Closed on
Jan 14, 2006
Sold by
Larsen Kenneth E and Larsen Carol B
Bought by
Kim Ki Ja
Home Financials for this Owner
Home Financials are based on the most recent Mortgage that was taken out on this home.
Original Mortgage
$359,000
Outstanding Balance
$157,236
Interest Rate
2.95%
Mortgage Type
Negative Amortization
Estimated Equity
$420,541
Purchase Details
Closed on
Mar 15, 1996
Sold by
Harris Bank Palatine
Bought by
Larsen Kenneth M and Larsen Carol B
Home Financials for this Owner
Home Financials are based on the most recent Mortgage that was taken out on this home.
Original Mortgage
$207,000
Interest Rate
7.46%
Create a Home Valuation Report for This Property
The Home Valuation Report is an in-depth analysis detailing your home's value as well as a comparison with similar homes in the area
Home Values in the Area
Average Home Value in this Area
Purchase History
| Date | Buyer | Sale Price | Title Company |
|---|---|---|---|
| Kim Ki Ja | -- | None Available | |
| Kim Ki Ja | -- | None Available | |
| Kim Ki Ja | -- | None Available | |
| Kim Ki Ja | $474,000 | Stewart Title Of Illinois | |
| Larsen Kenneth M | $329,000 | Attorneys Natl Title Network |
Source: Public Records
Mortgage History
| Date | Status | Borrower | Loan Amount |
|---|---|---|---|
| Open | Kim Ki Ja | $359,000 | |
| Previous Owner | Larsen Kenneth M | $207,000 |
Source: Public Records
Tax History
| Year | Tax Paid | Tax Assessment Tax Assessment Total Assessment is a certain percentage of the fair market value that is determined by local assessors to be the total taxable value of land and additions on the property. | Land | Improvement |
|---|---|---|---|---|
| 2025 | $9,830 | $49,000 | $8,941 | $40,059 |
| 2024 | $9,830 | $35,031 | $7,451 | $27,580 |
| 2023 | $9,457 | $38,000 | $7,451 | $30,549 |
| 2022 | $9,457 | $38,000 | $7,451 | $30,549 |
| 2021 | $8,566 | $31,561 | $5,215 | $26,346 |
| 2020 | $8,500 | $31,561 | $5,215 | $26,346 |
| 2019 | $8,460 | $35,068 | $5,215 | $29,853 |
| 2018 | $7,374 | $28,798 | $4,470 | $24,328 |
| 2017 | $7,277 | $28,798 | $4,470 | $24,328 |
| 2016 | $7,304 | $28,798 | $4,470 | $24,328 |
| 2015 | $6,526 | $24,816 | $3,911 | $20,905 |
| 2014 | $6,440 | $24,816 | $3,911 | $20,905 |
| 2013 | $6,244 | $24,816 | $3,911 | $20,905 |
Source: Public Records
Map
Nearby Homes
- 1300 Chatsworth Ln
- 1190 Woodcreek Ln
- 1365 Newcastle Ln
- 845 Harmon Blvd
- 1975 Leiter Way Unit 12002
- 1982 Leiter Way Unit 13004
- 1985 Leiter Way Unit 1102
- 1988 Leiter Way Unit 13001
- 1979 Leiter Way Unit 12004
- 1981 Leiter Way Unit 12005
- 1994 Leiter Way Unit 14003
- 1977 Leiter Way Unit 12003
- 1986 Leiter Way Unit 13002
- 1989 Leiter Way Unit 11004
- 775 Harmon Blvd
- 1355 Blair Ln
- 607 Wainsford Dr
- 712 Scarbrough Cir Unit 126
- 1033 Warwick Cir S
- 1708 Southbridge Ct
- 948 N Dexter Ln
- 940 N Dexter Ln
- 936 N Dexter Ln
- 930 N Dexter Ln
- 945 N Dexter Ln
- 935 N Dexter Ln
- 920 N Dexter Ln
- 925 N Dexter Ln
- 940 N Dovington Dr
- 910 N Dexter Ln
- 930 N Dovington Dr
- 915 N Dexter Ln
- 1320 W Dexter Ln
- 1425 Crowfoot Cir S
- 1415 Crowfoot Cir S
- 955 N Dovington Dr
- 900 N Dexter Ln
- 1435 Crowfoot Cir S
- 920 N Dovington Dr
- 945 N Dovington Dr
Your Personal Tour Guide
Ask me questions while you tour the home.