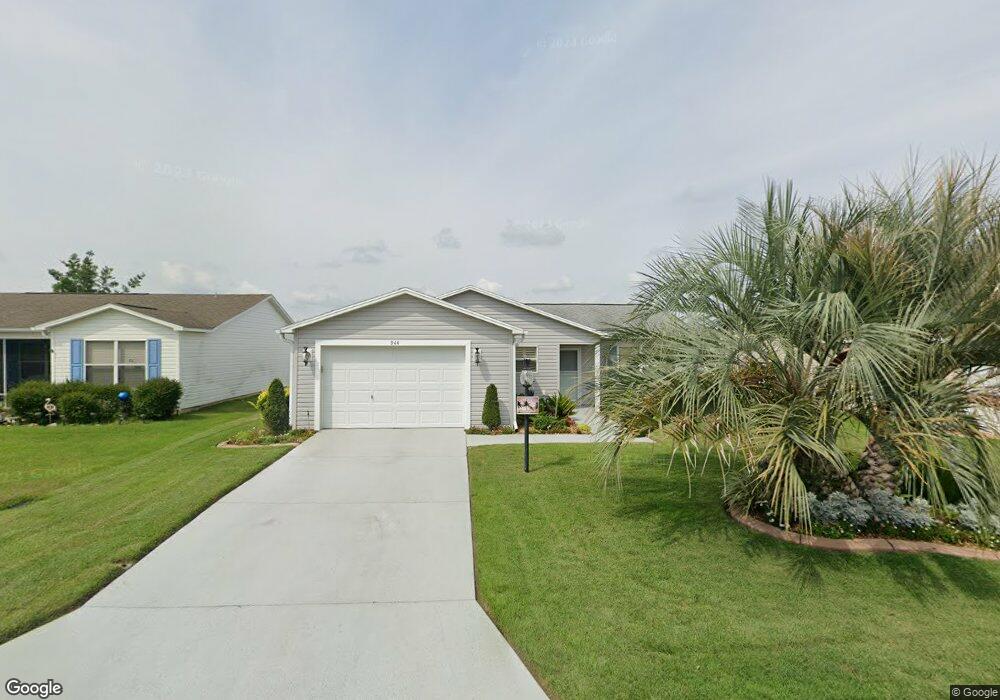
944 Nash Loop Unit 138 The Villages, FL 32162
Village of Hemingway NeighborhoodEstimated Value: $282,460 - $319,000
--
Bed
--
Bath
1,090
Sq Ft
$272/Sq Ft
Est. Value
About This Home
This home is located at 944 Nash Loop Unit 138, The Villages, FL 32162 and is currently estimated at $296,115, approximately $271 per square foot. 944 Nash Loop Unit 138 is a home located in Sumter County with nearby schools including Wildwood Elementary School and Wildwood Middle/High School.
Ownership History
Date
Name
Owned For
Owner Type
Purchase Details
Closed on
May 3, 2018
Sold by
Vaughan Wesley S and Vaughan Paula
Bought by
Olivero Frank A and Olivero Barbara M
Current Estimated Value
Home Financials for this Owner
Home Financials are based on the most recent Mortgage that was taken out on this home.
Original Mortgage
$130,000
Outstanding Balance
$112,037
Interest Rate
4.44%
Mortgage Type
New Conventional
Estimated Equity
$184,078
Purchase Details
Closed on
Dec 28, 2010
Sold by
Garmier Susan L
Bought by
Vaughan Wesley S and Vaughan Paula
Home Financials for this Owner
Home Financials are based on the most recent Mortgage that was taken out on this home.
Original Mortgage
$118,400
Interest Rate
4.4%
Mortgage Type
New Conventional
Purchase Details
Closed on
Aug 11, 2008
Sold by
The Villages Of Lake Sumter Inc
Bought by
Garmier Marvin E and Garmier Susan L
Home Financials for this Owner
Home Financials are based on the most recent Mortgage that was taken out on this home.
Original Mortgage
$119,728
Interest Rate
6.32%
Mortgage Type
Purchase Money Mortgage
Create a Home Valuation Report for This Property
The Home Valuation Report is an in-depth analysis detailing your home's value as well as a comparison with similar homes in the area
Home Values in the Area
Average Home Value in this Area
Purchase History
| Date | Buyer | Sale Price | Title Company |
|---|---|---|---|
| Olivero Frank A | $203,000 | Peninsula Land & Title | |
| Vaughan Wesley S | $148,000 | Attorney | |
| Garmier Marvin E | $149,700 | Attorney |
Source: Public Records
Mortgage History
| Date | Status | Borrower | Loan Amount |
|---|---|---|---|
| Open | Olivero Frank A | $130,000 | |
| Previous Owner | Vaughan Wesley S | $118,400 | |
| Previous Owner | Garmier Marvin E | $119,728 |
Source: Public Records
Tax History Compared to Growth
Tax History
| Year | Tax Paid | Tax Assessment Tax Assessment Total Assessment is a certain percentage of the fair market value that is determined by local assessors to be the total taxable value of land and additions on the property. | Land | Improvement |
|---|---|---|---|---|
| 2024 | $3,402 | $184,630 | -- | -- |
| 2023 | $3,402 | $179,260 | $0 | $0 |
| 2022 | $3,274 | $174,040 | $0 | $0 |
| 2021 | $3,377 | $168,980 | $21,610 | $147,370 |
| 2020 | $3,568 | $179,080 | $0 | $0 |
| 2019 | $3,572 | $175,060 | $16,250 | $158,810 |
| 2018 | $3,608 | $154,310 | $16,250 | $138,060 |
| 2017 | $2,911 | $126,040 | $0 | $0 |
| 2016 | $2,857 | $123,450 | $0 | $0 |
| 2015 | $2,868 | $122,600 | $0 | $0 |
| 2014 | $3,000 | $121,630 | $0 | $0 |
Source: Public Records
Map
Nearby Homes
- 891 Bartlet Ln
- 915 Chapman Loop
- 1001 Greyford Ln
- 892 Nash Loop
- 2516 Banning Ct
- 971 Margaux Trail
- 2495 Dundee Terrace
- 879 Chapman Loop
- 2552 Mariel Way
- 2454 Monroe Terrace
- 859 Chapman Loop
- 1065 Berg Ct
- 1053 Nash Loop
- 2739 Midland Terrace
- 2355 Glade Run
- 1135 Burke Ct
- 1098 Burnettown Place
- 2530 Saffron Ln
- 2725 Halsey Terrace
- 1266 James Island St
- 948 Nash Loop
- 940 Nash Loop
- 927 Margaux Trail
- 931 Margaux Trail
- 923 Margaux Trail
- 952 Nash Loop
- 935 Margaux Trail
- 919 Margaux Trail
- 945 Nash Loop
- 939 Margaux Trail
- 941 Nash Loop
- 936 Nash Loop
- 949 Nash Loop
- 915 Margaux Trail
- 956 Nash Loop
- 943 Margaux Trail
- 937 Nash Loop
- 953 Nash Loop
- 911 Margaux Trail