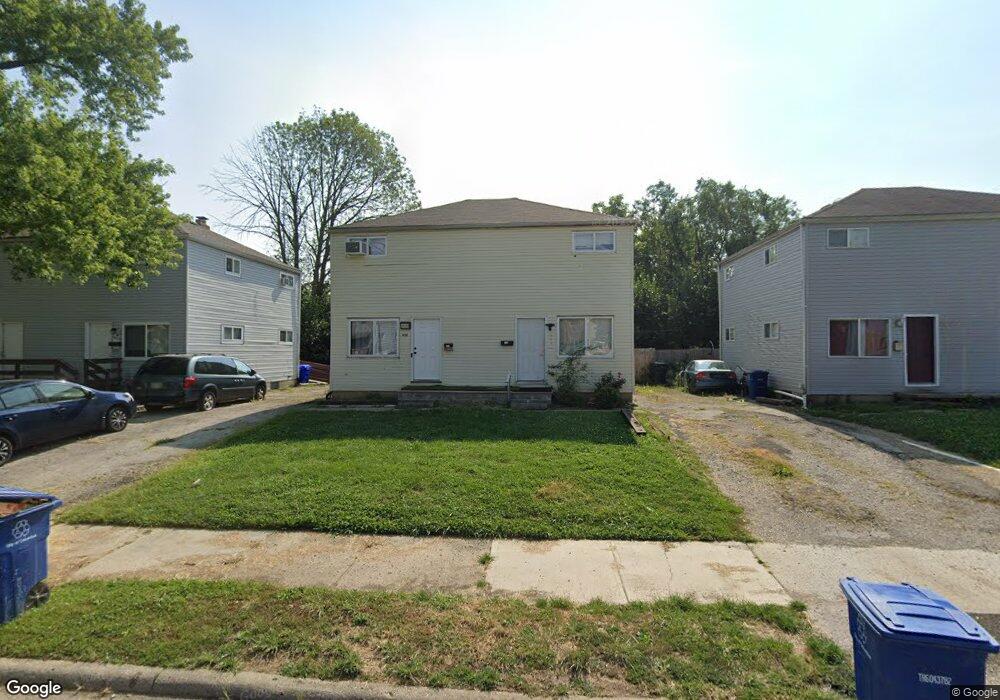
944 Racine Ave Unit 946 Columbus, OH 43204
Brookshire NeighborhoodEstimated Value: $133,000 - $200,000
4
Beds
2
Baths
1,716
Sq Ft
$101/Sq Ft
Est. Value
About This Home
This home is located at 944 Racine Ave Unit 946, Columbus, OH 43204 and is currently estimated at $173,270, approximately $100 per square foot. 944 Racine Ave Unit 946 is a home located in Franklin County with nearby schools including Lindbergh Elementary School, Hilltonia Middle School, and Briggs High School.
Ownership History
Date
Name
Owned For
Owner Type
Purchase Details
Closed on
Jun 3, 2022
Sold by
John Factor
Bought by
Torres-Torresilla Nayeli
Current Estimated Value
Home Financials for this Owner
Home Financials are based on the most recent Mortgage that was taken out on this home.
Original Mortgage
$5,500
Outstanding Balance
$5,225
Interest Rate
5.09%
Estimated Equity
$168,045
Purchase Details
Closed on
Apr 5, 2001
Sold by
Nebbergall Thomas Q
Bought by
Factor John
Home Financials for this Owner
Home Financials are based on the most recent Mortgage that was taken out on this home.
Original Mortgage
$40,000
Interest Rate
7.13%
Purchase Details
Closed on
Feb 26, 1997
Sold by
Commercial Team Investme
Bought by
D'Alberto Antonio
Home Financials for this Owner
Home Financials are based on the most recent Mortgage that was taken out on this home.
Original Mortgage
$47,450
Interest Rate
7.93%
Mortgage Type
New Conventional
Create a Home Valuation Report for This Property
The Home Valuation Report is an in-depth analysis detailing your home's value as well as a comparison with similar homes in the area
Home Values in the Area
Average Home Value in this Area
Purchase History
| Date | Buyer | Sale Price | Title Company |
|---|---|---|---|
| Torres-Torresilla Nayeli | $110,000 | Access Title Agency | |
| Factor John | $57,400 | Lawyers Title | |
| D'Alberto Antonio | $73,000 | -- |
Source: Public Records
Mortgage History
| Date | Status | Borrower | Loan Amount |
|---|---|---|---|
| Open | Torres-Torresilla Nayeli | $5,500 | |
| Open | Torres-Torresilla Nayeli | $108,007 | |
| Previous Owner | Factor John | $40,000 | |
| Previous Owner | D'Alberto Antonio | $47,450 |
Source: Public Records
Tax History Compared to Growth
Tax History
| Year | Tax Paid | Tax Assessment Tax Assessment Total Assessment is a certain percentage of the fair market value that is determined by local assessors to be the total taxable value of land and additions on the property. | Land | Improvement |
|---|---|---|---|---|
| 2024 | $2,288 | $50,440 | $7,350 | $43,090 |
| 2023 | $2,409 | $50,440 | $7,350 | $43,090 |
| 2022 | $1,544 | $29,050 | $6,790 | $22,260 |
| 2021 | $1,547 | $29,050 | $6,790 | $22,260 |
| 2020 | $1,549 | $29,050 | $6,790 | $22,260 |
| 2019 | $1,506 | $24,220 | $5,670 | $18,550 |
| 2018 | $752 | $24,220 | $5,670 | $18,550 |
| 2017 | $1,506 | $24,220 | $5,670 | $18,550 |
| 2016 | $1,298 | $19,110 | $4,340 | $14,770 |
| 2015 | $591 | $19,110 | $4,340 | $14,770 |
| 2014 | $1,185 | $19,110 | $4,340 | $14,770 |
| 2013 | $688 | $22,505 | $5,110 | $17,395 |
Source: Public Records
Map
Nearby Homes
- 903 S Harris Ave
- 2783-2785 Vanderberg Ave
- 2743 Saint Joseph Ave
- 2743 Bernadette Rd
- 1060 Saint Agnes Ave
- 898 Chestershire Rd
- 804 S Hague Ave
- 2687 Vanderberg Ave
- 3029 Rosedale Ave
- 890 S Roys Ave
- 814 Chestershire Rd
- 805 S Warren Ave
- 790 Racine Ave
- 1037 Chestershire Rd
- 2929 Briggs Rd
- 975 Hodges Dr
- 828 Binns Blvd
- 733 S Hague Ave
- 2610 Spaatz Ave
- 2588 Regina Ave
- 944-946 Racine Ave
- 938-940 Racine Ave
- 938 Racine Ave Unit 940
- 950 Racine Ave Unit 952
- 950-952 Racine Ave
- 930 Racine Ave Unit 932
- 951 S Warren Ave
- 943 S Warren Ave
- 957 S Warren Ave
- 2826 Saint Joseph Ave
- 2816 Saint Joseph Ave
- 937 S Warren Ave
- 924-926 Racine Ave
- 924 Racine Ave Unit 926
- 926 Racine Ave
- 937 Racine Ave Unit 939
- 945-947 Racine Ave
- 945 Racine Ave Unit 947
- 931-933 Racine Ave
- 931 Racine Ave Unit 933