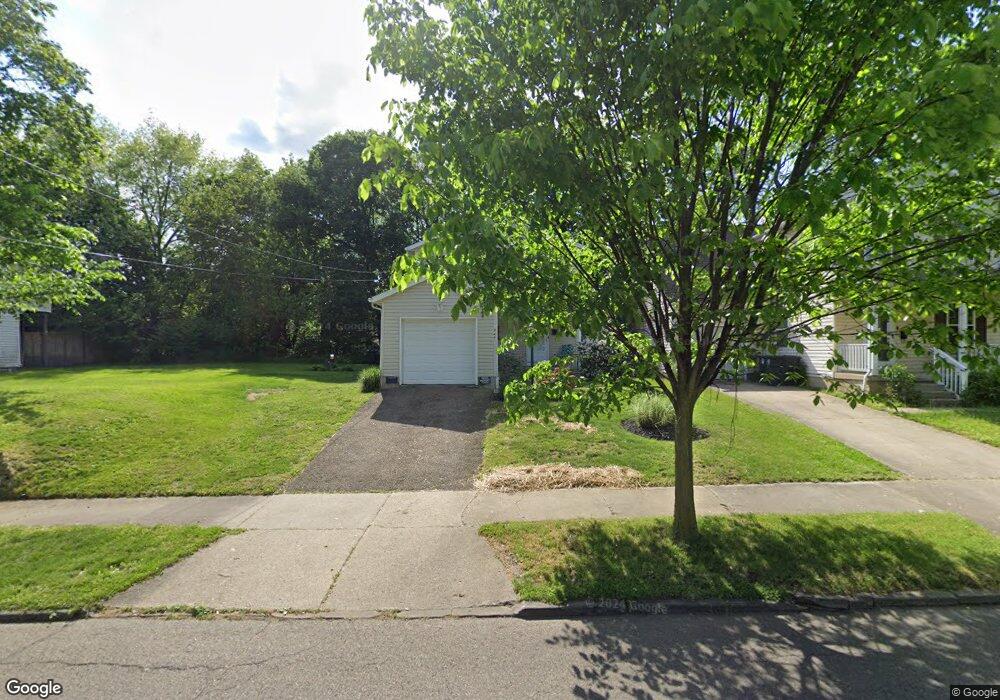
944 Raymond St Akron, OH 44307
Sherbondy Hill NeighborhoodEstimated Value: $75,000 - $197,000
3
Beds
2
Baths
1,152
Sq Ft
$98/Sq Ft
Est. Value
About This Home
This home is located at 944 Raymond St, Akron, OH 44307 and is currently estimated at $113,164, approximately $98 per square foot. 944 Raymond St is a home located in Summit County with nearby schools including St. Bernard-St. Mary Elementary School.
Ownership History
Date
Name
Owned For
Owner Type
Purchase Details
Closed on
Nov 12, 2012
Sold by
Bridges Garret Yolanda N and Bridges Yolanda N
Bought by
Bridges Garrett Yolanda N
Current Estimated Value
Home Financials for this Owner
Home Financials are based on the most recent Mortgage that was taken out on this home.
Original Mortgage
$104,550
Outstanding Balance
$72,621
Interest Rate
3.5%
Mortgage Type
FHA
Estimated Equity
$40,543
Purchase Details
Closed on
Aug 12, 2005
Sold by
Evergreen Homes Llc
Bought by
Bridges Yolanda N
Home Financials for this Owner
Home Financials are based on the most recent Mortgage that was taken out on this home.
Original Mortgage
$91,920
Interest Rate
5.84%
Mortgage Type
Fannie Mae Freddie Mac
Purchase Details
Closed on
Nov 22, 2004
Sold by
Moore Malcolm and Moore Yalinda A
Bought by
Evergreen Homes Llc
Purchase Details
Closed on
Sep 29, 2004
Sold by
Payback Builders Inc
Bought by
Moore Malcolm
Purchase Details
Closed on
Mar 12, 2004
Sold by
Green Romaden and Green Romaden
Bought by
Payback Builders Inc
Create a Home Valuation Report for This Property
The Home Valuation Report is an in-depth analysis detailing your home's value as well as a comparison with similar homes in the area
Home Values in the Area
Average Home Value in this Area
Purchase History
| Date | Buyer | Sale Price | Title Company |
|---|---|---|---|
| Bridges Garrett Yolanda N | -- | None Available | |
| Bridges Yolanda N | $114,900 | First Security Title Corp | |
| Evergreen Homes Llc | $3,500 | First Security Title Corp | |
| Moore Malcolm | $1,600 | -- | |
| Payback Builders Inc | $5,600 | Cathcor Title Agency Inc |
Source: Public Records
Mortgage History
| Date | Status | Borrower | Loan Amount |
|---|---|---|---|
| Open | Bridges Garrett Yolanda N | $104,550 | |
| Previous Owner | Bridges Yolanda N | $91,920 | |
| Closed | Bridges Yolanda N | $22,980 |
Source: Public Records
Tax History
| Year | Tax Paid | Tax Assessment Tax Assessment Total Assessment is a certain percentage of the fair market value that is determined by local assessors to be the total taxable value of land and additions on the property. | Land | Improvement |
|---|---|---|---|---|
| 2025 | $938 | $16,674 | $3,185 | $13,489 |
| 2024 | $938 | $16,674 | $3,185 | $13,489 |
| 2023 | $938 | $16,674 | $3,185 | $13,489 |
| 2022 | $723 | $9,811 | $1,876 | $7,935 |
| 2021 | $724 | $9,811 | $1,876 | $7,935 |
| 2020 | $714 | $9,820 | $1,880 | $7,940 |
| 2019 | $923 | $11,880 | $2,580 | $9,300 |
| 2018 | $912 | $11,880 | $2,580 | $9,300 |
| 2017 | $949 | $11,880 | $2,580 | $9,300 |
| 2016 | $946 | $12,160 | $2,580 | $9,580 |
| 2015 | $949 | $12,210 | $2,580 | $9,630 |
| 2014 | $942 | $12,210 | $2,580 | $9,630 |
| 2013 | $925 | $12,230 | $2,580 | $9,650 |
Source: Public Records
Map
Nearby Homes
- 443 W Thornton St
- 939 Lane St
- 994 Moeller Ave
- 1011 Laurel Ave
- 817 Raymond St
- 963 Morningstar Dr
- 834 Kenyon St
- 839 Kenyon St
- 1021 La Croix Ave
- 258 Oberlin Ct
- 777 Ruth Ave
- 628 Bellevue Ave
- 702 W Thornton St
- 849 Amherst St
- 163 Russell Ave
- 776 Krause Ct
- 829 Yale St
- 108 Furnace Run Dr Unit 14108
- 837 Yale St
- 985 Diana Ave
Your Personal Tour Guide
Ask me questions while you tour the home.