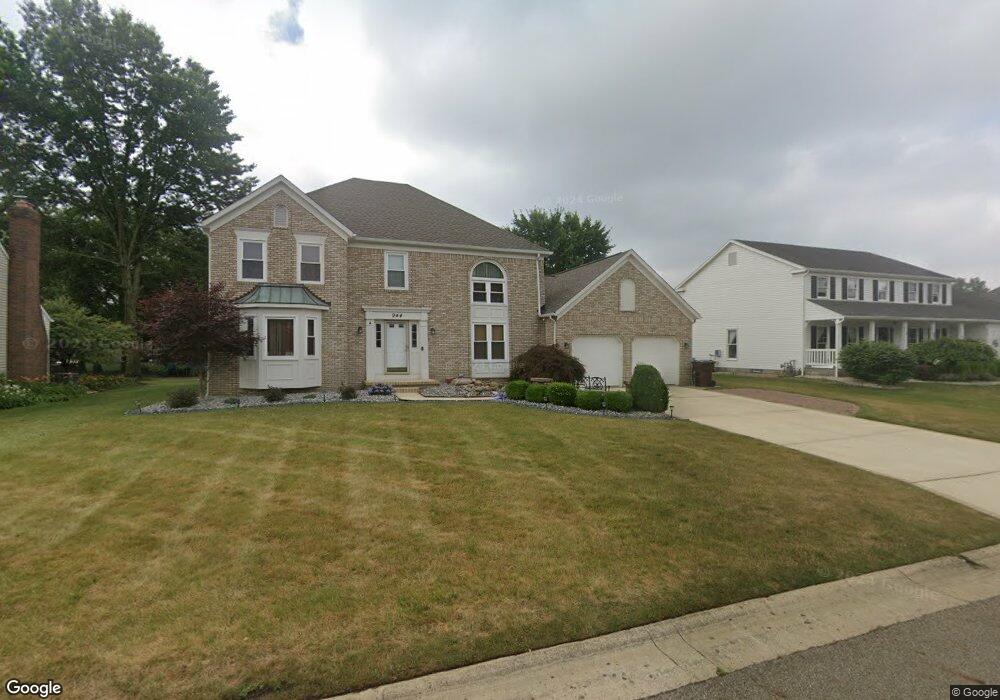
944 S Commons Cir NE Canton, OH 44721
Estimated Value: $385,059 - $427,000
4
Beds
3
Baths
2,952
Sq Ft
$137/Sq Ft
Est. Value
About This Home
This home is located at 944 S Commons Cir NE, Canton, OH 44721 and is currently estimated at $405,515, approximately $137 per square foot. 944 S Commons Cir NE is a home located in Stark County with nearby schools including Charles L. Warstler Elementary School, Oakwood Middle School, and GlenOak High School.
Ownership History
Date
Name
Owned For
Owner Type
Purchase Details
Closed on
Sep 30, 2004
Sold by
Mosher Gary A and Mosher Denise A
Bought by
Sheppard James M
Current Estimated Value
Home Financials for this Owner
Home Financials are based on the most recent Mortgage that was taken out on this home.
Original Mortgage
$198,000
Outstanding Balance
$99,109
Interest Rate
5.93%
Mortgage Type
Purchase Money Mortgage
Estimated Equity
$306,406
Purchase Details
Closed on
Nov 15, 1996
Sold by
Redwood Paul F
Bought by
Mosher Gary A and Mosher Denise
Home Financials for this Owner
Home Financials are based on the most recent Mortgage that was taken out on this home.
Original Mortgage
$149,600
Interest Rate
8.18%
Mortgage Type
New Conventional
Purchase Details
Closed on
Dec 29, 1992
Purchase Details
Closed on
Mar 26, 1991
Create a Home Valuation Report for This Property
The Home Valuation Report is an in-depth analysis detailing your home's value as well as a comparison with similar homes in the area
Home Values in the Area
Average Home Value in this Area
Purchase History
| Date | Buyer | Sale Price | Title Company |
|---|---|---|---|
| Sheppard James M | $220,000 | -- | |
| Mosher Gary A | $176,000 | -- | |
| -- | $172,000 | -- | |
| -- | -- | -- |
Source: Public Records
Mortgage History
| Date | Status | Borrower | Loan Amount |
|---|---|---|---|
| Open | Sheppard James M | $198,000 | |
| Previous Owner | Mosher Gary A | $149,600 |
Source: Public Records
Tax History Compared to Growth
Tax History
| Year | Tax Paid | Tax Assessment Tax Assessment Total Assessment is a certain percentage of the fair market value that is determined by local assessors to be the total taxable value of land and additions on the property. | Land | Improvement |
|---|---|---|---|---|
| 2025 | -- | $133,780 | $29,230 | $104,550 |
| 2024 | -- | $133,780 | $29,230 | $104,550 |
| 2023 | $4,224 | $90,690 | $20,580 | $70,110 |
| 2022 | $4,242 | $90,690 | $20,580 | $70,110 |
| 2021 | $4,261 | $90,690 | $20,580 | $70,110 |
| 2020 | $4,121 | $79,840 | $17,750 | $62,090 |
| 2019 | $4,087 | $79,840 | $17,750 | $62,090 |
| 2018 | $4,037 | $79,840 | $17,750 | $62,090 |
| 2017 | $4,205 | $76,380 | $17,330 | $59,050 |
| 2016 | $4,507 | $81,660 | $17,330 | $64,330 |
| 2015 | $4,356 | $81,660 | $17,330 | $64,330 |
| 2014 | $1,952 | $72,460 | $15,370 | $57,090 |
| 2013 | $1,926 | $72,460 | $15,370 | $57,090 |
Source: Public Records
Map
Nearby Homes
- 5845 Royal Hill Cir NE
- 5634 Brentwood Ave NW
- 5901 Market Ave N
- 5225 Loma Linda Ln NE
- 6816 Harrington Court Ave NE
- 308 52nd St NW
- 1711 Glenmar Oval SE
- 1904 Red Coach Rd NW
- 2040 55th St NE
- 1573 Lancaster Gate SE
- 5147 Susetta Ave NW
- 723 Jennifer Dr NW
- 6010 Firestone Rd NE
- 1614 Bellview St NE
- 1563 Bellview St NE
- 1542 Alexandria Pkwy SE
- 4662 Helmsworth Dr NE
- 5409 Glenhill Ave NE
- 1627 Seabiscuit Dr NE
- 1402 Schneider St NW
- 956 S Commons Cir NE
- 938 S Commons Cir NE
- 931 Southmoor Cir NE
- 941 Southmoor Cir NE
- 926 S Commons Cir NE
- 960 S Commons Cir NE
- 943 S Commons Cir NE
- 939 S Commons Cir NE
- 955 S Commons Cir NE
- 913 Southmoor Cir NE
- 927 S Commons Cir NE
- 918 S Commons Cir NE
- 959 S Commons Cir NE
- 964 S Commons Cir NE
- 919 S Commons Cir NE
- 905 Southmoor Cir NE
- 955 Southmoor Cir NE
- 1020 Cobblefield St NE
- 910 S Commons Cir NE
- 963 S Commons Cir NE