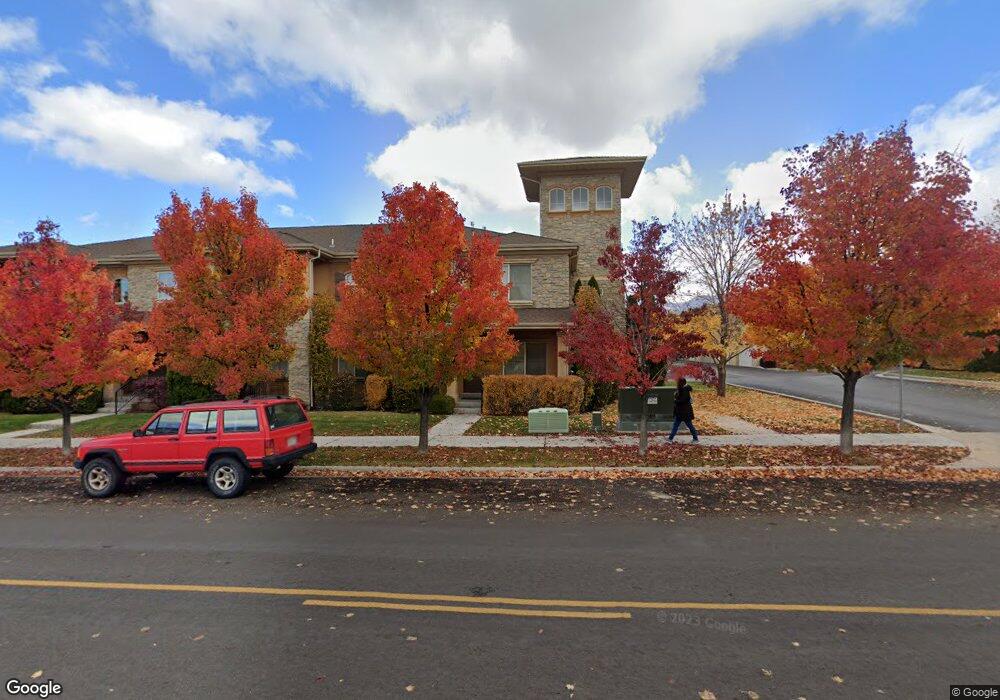
944 W 880 N Orem, UT 84057
Bonneville NeighborhoodEstimated Value: $469,085 - $537,000
3
Beds
3
Baths
1,744
Sq Ft
$280/Sq Ft
Est. Value
About This Home
This home is located at 944 W 880 N, Orem, UT 84057 and is currently estimated at $488,771, approximately $280 per square foot. 944 W 880 N is a home located in Utah County with nearby schools including Bonneville Elementary School, Orem Junior High School, and Timpanogos High School.
Ownership History
Date
Name
Owned For
Owner Type
Purchase Details
Closed on
Feb 23, 2021
Sold by
Mann Ashlie and Mann Christopher
Bought by
Brenner Robert S
Current Estimated Value
Purchase Details
Closed on
May 11, 2020
Sold by
Mann Christopher and Mann Ashlie
Bought by
Mann Ashlie and Mann Christopher
Home Financials for this Owner
Home Financials are based on the most recent Mortgage that was taken out on this home.
Original Mortgage
$181,500
Interest Rate
3.5%
Mortgage Type
New Conventional
Purchase Details
Closed on
Jul 25, 2007
Sold by
Gunsmoke Properties Llc
Bought by
Mann Christopher and Mann Ashlie
Home Financials for this Owner
Home Financials are based on the most recent Mortgage that was taken out on this home.
Original Mortgage
$221,825
Interest Rate
6.73%
Mortgage Type
Purchase Money Mortgage
Create a Home Valuation Report for This Property
The Home Valuation Report is an in-depth analysis detailing your home's value as well as a comparison with similar homes in the area
Home Values in the Area
Average Home Value in this Area
Purchase History
| Date | Buyer | Sale Price | Title Company |
|---|---|---|---|
| Brenner Robert S | -- | Bartlett Title Ins Agnecy | |
| Mann Ashlie | -- | Meridian Title Company | |
| Mann Christopher | -- | Provo Land Title Company | |
| Gunsmoke Properties Llc | -- | Provo Land Title Company |
Source: Public Records
Mortgage History
| Date | Status | Borrower | Loan Amount |
|---|---|---|---|
| Previous Owner | Mann Ashlie | $181,500 | |
| Previous Owner | Mann Christopher | $221,825 |
Source: Public Records
Tax History
| Year | Tax Paid | Tax Assessment Tax Assessment Total Assessment is a certain percentage of the fair market value that is determined by local assessors to be the total taxable value of land and additions on the property. | Land | Improvement |
|---|---|---|---|---|
| 2025 | $2,028 | $264,880 | -- | -- |
| 2024 | $2,028 | $247,995 | $0 | $0 |
| 2023 | $1,837 | $241,450 | $0 | $0 |
| 2022 | $1,870 | $238,040 | $0 | $0 |
| 2021 | $1,687 | $325,400 | $48,800 | $276,600 |
| 2020 | $1,624 | $307,800 | $46,200 | $261,600 |
| 2019 | $1,518 | $299,100 | $44,900 | $254,200 |
| 2018 | $1,434 | $270,000 | $40,500 | $229,500 |
| 2017 | $1,472 | $148,500 | $0 | $0 |
| 2016 | $1,478 | $137,500 | $0 | $0 |
| 2015 | $1,563 | $137,500 | $0 | $0 |
| 2014 | $1,470 | $128,700 | $0 | $0 |
Source: Public Records
Map
Nearby Homes
- 1015 N 995 W
- 999 W 1100 N
- 1004 N 1090 W Unit 203
- 1140 W 950 N Unit D302
- 1140 W 950 N Unit E202
- 1140 W 950 N Unit D304
- 1123 N 800 W
- 954 W 630 N Unit 34,
- 686 N 835 W
- 645 W 920 N
- 1058 W 570 St N
- 1230 N 685 W
- 875 W 530 N
- 510 N 940 W
- 557 N Emery Ave
- 538 W 1120 N
- 1094 W 465 N
- 663 N 550 W
- 1405 N 770 W
- 1244 N 580 W
Your Personal Tour Guide
Ask me questions while you tour the home.