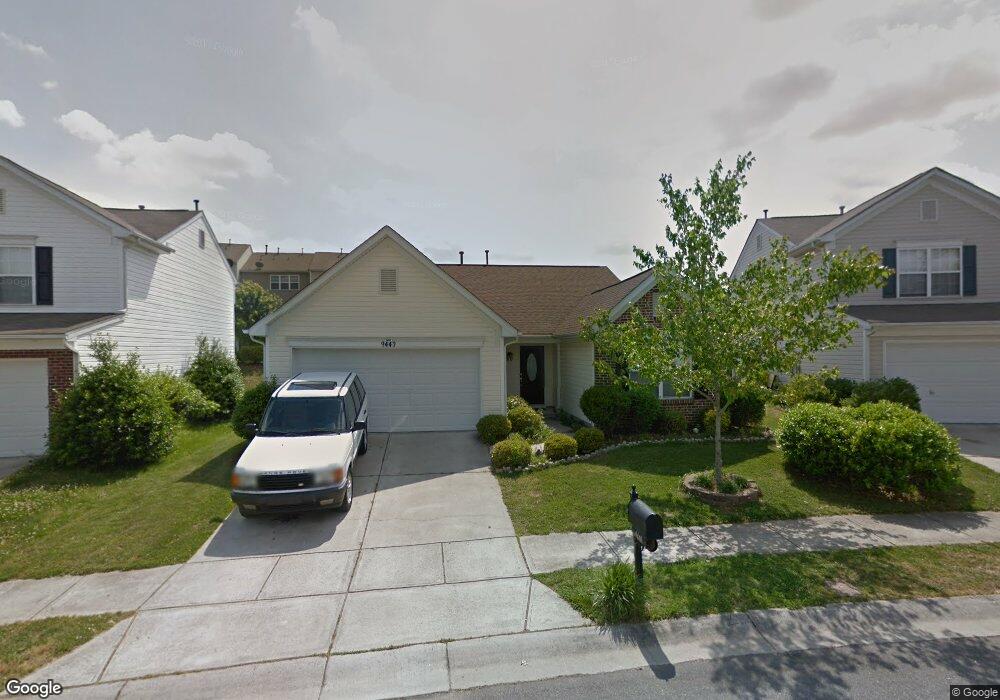
9440 Grand Oaks St NW Concord, NC 28027
Estimated Value: $377,000 - $391,639
3
Beds
2
Baths
1,691
Sq Ft
$228/Sq Ft
Est. Value
About This Home
This home is located at 9440 Grand Oaks St NW, Concord, NC 28027 and is currently estimated at $385,910, approximately $228 per square foot. 9440 Grand Oaks St NW is a home located in Cabarrus County with nearby schools including W.R. Odell Elementary School, Harris Road Middle, and Cox Mill High School.
Ownership History
Date
Name
Owned For
Owner Type
Purchase Details
Closed on
May 15, 2024
Sold by
Johnson India and Johnson Deandre
Bought by
Johnson India and Johnson Deandre
Current Estimated Value
Purchase Details
Closed on
Jul 15, 2015
Sold by
Wiggins Margaret G
Bought by
Johnson India and Johnson Deandre
Home Financials for this Owner
Home Financials are based on the most recent Mortgage that was taken out on this home.
Original Mortgage
$169,375
Interest Rate
4.5%
Mortgage Type
FHA
Purchase Details
Closed on
Mar 27, 2007
Sold by
Barrier Janesha
Bought by
Hud
Purchase Details
Closed on
Dec 30, 2004
Sold by
Mdc Homes Charlotte Llc
Bought by
Barrier Janesha
Home Financials for this Owner
Home Financials are based on the most recent Mortgage that was taken out on this home.
Original Mortgage
$150,150
Interest Rate
5.66%
Mortgage Type
FHA
Purchase Details
Closed on
Jul 7, 2004
Sold by
J & B Development & Management Inc
Bought by
Mdc Homes Charlotte Llc
Create a Home Valuation Report for This Property
The Home Valuation Report is an in-depth analysis detailing your home's value as well as a comparison with similar homes in the area
Home Values in the Area
Average Home Value in this Area
Purchase History
| Date | Buyer | Sale Price | Title Company |
|---|---|---|---|
| Johnson India | -- | None Listed On Document | |
| Johnson India | -- | None Listed On Document | |
| Johnson India | $172,500 | Barristers Title | |
| Hud | $161,797 | None Available | |
| Barrier Janesha | $152,500 | -- | |
| Mdc Homes Charlotte Llc | $140,000 | -- |
Source: Public Records
Mortgage History
| Date | Status | Borrower | Loan Amount |
|---|---|---|---|
| Previous Owner | Johnson India | $169,375 | |
| Previous Owner | Barrier Janesha | $150,150 |
Source: Public Records
Tax History Compared to Growth
Tax History
| Year | Tax Paid | Tax Assessment Tax Assessment Total Assessment is a certain percentage of the fair market value that is determined by local assessors to be the total taxable value of land and additions on the property. | Land | Improvement |
|---|---|---|---|---|
| 2025 | $3,716 | $373,050 | $84,000 | $289,050 |
| 2024 | $3,716 | $373,050 | $84,000 | $289,050 |
| 2023 | $2,702 | $221,490 | $52,000 | $169,490 |
| 2022 | $2,702 | $221,490 | $52,000 | $169,490 |
| 2021 | $2,702 | $221,490 | $52,000 | $169,490 |
| 2020 | $2,702 | $221,490 | $52,000 | $169,490 |
| 2019 | $2,008 | $164,620 | $38,000 | $126,620 |
| 2018 | $1,975 | $164,620 | $38,000 | $126,620 |
| 2017 | $1,943 | $164,620 | $38,000 | $126,620 |
| 2016 | $1,152 | $148,090 | $33,000 | $115,090 |
| 2015 | $1,747 | $148,090 | $33,000 | $115,090 |
| 2014 | $1,747 | $148,090 | $33,000 | $115,090 |
Source: Public Records
Map
Nearby Homes
- 9768 Walkers Glen Dr NW
- 9720 Walkers Glen Dr NW
- 9803 Walkers Glen Dr NW
- 1266 Amber Ridge Rd NW
- 1418 Skidaway St NW Unit 427
- 1498 Burrell Ave NW
- 9610 Walkers Glen Dr NW
- 9430 Pepperidge Ave NW
- 9611 Marquette St NW
- 1423 Napa St NW
- 9593 Valencia Ave NW
- 1656 Respect St NW
- 1648 Respect St NW
- 1559 Broderick St NW
- 9515 Coast Laurel Ave NW
- 9532 Teamwork St NW
- 9528 Teamwork St NW
- 9526 Teamwork St NW
- 9524 Teamwork St NW
- 1598 Respect St NW
- 9444 Grand Oaks St NW
- 9436 Grand Oaks St NW
- 9448 Grand Oaks St NW
- 9448 Grand Oaks St NW
- 9448 Grand Oaks St NW Unit 12
- 9432 Grand Oaks St NW
- 9740 Walkers Glen Dr NW
- 9740 Walkers Glen Dr NW Unit 27
- 9748 Walkers Glen Dr NW
- 9744 Walkers Glen Dr NW
- 9443 Grand Oaks St NW
- 9752 Walkers Glen Dr NW Unit 24
- 9752 Walkers Glen Dr NW
- 9736 Walkers Glen Dr NW
- 9433 Grand Oaks St NW
- 9756 Walkers Glen Dr NW
- 9756 Walkers Glen Dr NW Unit L23
- 9447 Grand Oaks St NW
- 9760 Walkers Glen Dr NW
- 9760 Walkers Glen Dr NW Unit 9760