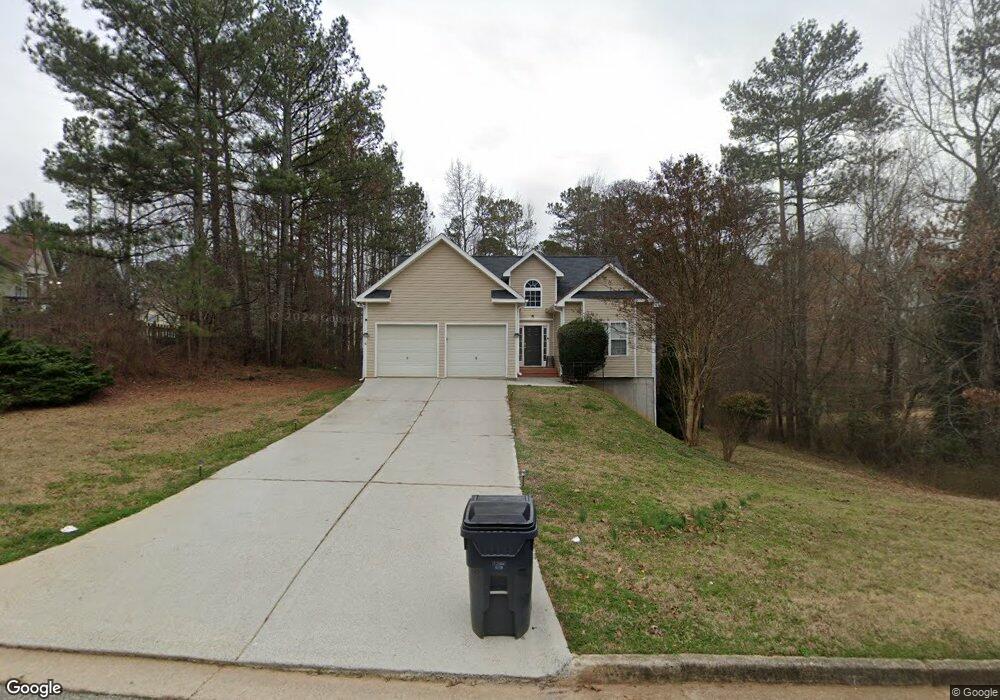
9440 Pebble Creek Ct Unit 22 Villa Rica, GA 30180
Estimated Value: $275,000 - $324,945
3
Beds
3
Baths
1,287
Sq Ft
$226/Sq Ft
Est. Value
About This Home
This home is located at 9440 Pebble Creek Ct Unit 22, Villa Rica, GA 30180 and is currently estimated at $290,486, approximately $225 per square foot. 9440 Pebble Creek Ct Unit 22 is a home located in Douglas County with nearby schools including Mason Creek Elementary School, Mason Creek Middle School, and Alexander High School.
Ownership History
Date
Name
Owned For
Owner Type
Purchase Details
Closed on
Nov 9, 2021
Sold by
Sfr Jv 1 Property Llc
Bought by
Sfr Jv 1 2021 1 Borrower Llc
Current Estimated Value
Purchase Details
Closed on
Apr 30, 2021
Sold by
Sutton Gloria Jean
Bought by
Sfr Jv-1 Property Llc
Purchase Details
Closed on
Feb 23, 2021
Sold by
Lake Cumberland Investments Llc
Bought by
Sfr Jv 1 Property Llc
Purchase Details
Closed on
May 11, 2012
Sold by
The Bank Of Nwy York Mello
Bought by
Lake Cumberland Investments Ll
Purchase Details
Closed on
Sep 14, 2011
Sold by
Smith Jason
Bought by
Bank Of America Na
Purchase Details
Closed on
Sep 17, 2002
Sold by
Kirkwood Bldrs Inc
Bought by
Smith Tina M and Smith Jason L
Home Financials for this Owner
Home Financials are based on the most recent Mortgage that was taken out on this home.
Original Mortgage
$143,200
Interest Rate
6.18%
Mortgage Type
FHA
Create a Home Valuation Report for This Property
The Home Valuation Report is an in-depth analysis detailing your home's value as well as a comparison with similar homes in the area
Home Values in the Area
Average Home Value in this Area
Purchase History
| Date | Buyer | Sale Price | Title Company |
|---|---|---|---|
| Sfr Jv 1 2021 1 Borrower Llc | -- | -- | |
| Sfr Jv-1 Property Llc | $210,000 | None Listed On Document | |
| Sfr Jv 1 Property Llc | $200,000 | -- | |
| Lake Cumberland Investments Ll | $59,000 | -- | |
| Bank Of America Na | $116,840 | -- | |
| Smith Tina M | $145,000 | -- |
Source: Public Records
Mortgage History
| Date | Status | Borrower | Loan Amount |
|---|---|---|---|
| Previous Owner | Smith Tina M | $143,200 |
Source: Public Records
Tax History Compared to Growth
Tax History
| Year | Tax Paid | Tax Assessment Tax Assessment Total Assessment is a certain percentage of the fair market value that is determined by local assessors to be the total taxable value of land and additions on the property. | Land | Improvement |
|---|---|---|---|---|
| 2024 | $3,432 | $92,640 | $13,880 | $78,760 |
| 2023 | $3,432 | $77,520 | $12,600 | $64,920 |
| 2022 | $3,009 | $77,520 | $12,600 | $64,920 |
| 2021 | $2,504 | $64,440 | $12,720 | $51,720 |
| 2020 | $2,540 | $64,440 | $12,720 | $51,720 |
| 2019 | $2,312 | $63,000 | $12,720 | $50,280 |
| 2018 | $2,038 | $54,840 | $11,320 | $43,520 |
| 2017 | $1,996 | $52,400 | $12,080 | $40,320 |
| 2016 | $1,879 | $48,480 | $11,440 | $37,040 |
| 2015 | $1,635 | $41,440 | $12,000 | $29,440 |
| 2014 | $1,709 | $49,600 | $15,360 | $34,240 |
| 2013 | -- | $50,480 | $15,680 | $34,800 |
Source: Public Records
Map
Nearby Homes
- 3450 Laurel Springs Cove
- 3395 Laurel Springs Cove
- 3395 Woodlake Ln
- 166 Millwheel Dr
- 102 Rocky Branch Way
- 219 Millwheel Dr
- 106 Rocky Branch Way
- 9427 Poole Rd
- 3405 Cascade Trail
- 9720 Poole Rd
- 3425 Lake Breeze Ct
- 3657 Liberty Rd
- 3545 Liberty Rd
- 3940 Clinton Ct
- 4020 Gold Springs Pass
- 222 Bastian Dr Unit 115
- 222 Bastian Dr
- 210 Villa Rica Springs
- 401 Bass Cir
- 114 Crooked Lake Park
- 9440 Pebble Creek Ct
- 3415 Laurel Springs Cove
- 9450 Pebble Creek Ct
- 3425 Laurel Springs Cove
- 9245 Pebble Creek Ct
- 9460 Pebble Creek Ct
- 9405 Pebble Creek Ct
- 9415 Pebble Creek Ct
- 3405 Laurel Springs Cove
- 3435 Laurel Springs Cove
- 9425 Pebble Creek Ct
- 3420 Laurel Springs Cove
- 3440 Laurel Springs Cove
- 3410 Laurel Springs Cove
- 0 Pebble Creek Ct Unit 7442670
- 0 Pebble Creek Ct Unit 8099175
- 0 Pebble Creek Ct Unit 8864908
- 0 Pebble Creek Ct Unit 7398205
- 0 Pebble Creek Ct Unit 7300198
- 0 Pebble Creek Ct Unit 7171684