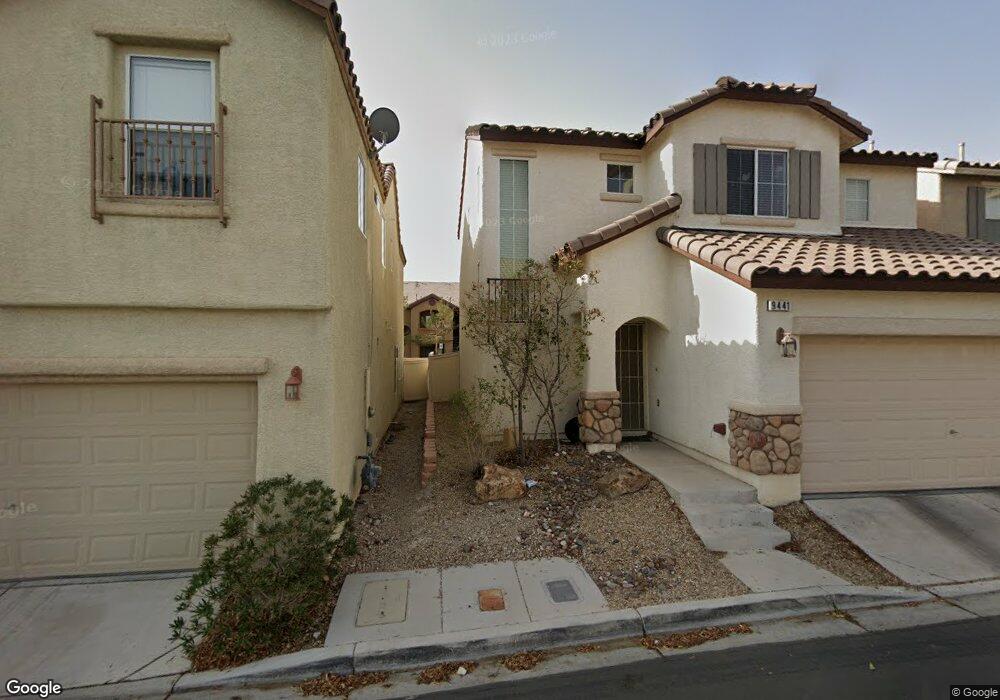
9441 Havasu Canyon Ave Las Vegas, NV 89166
Estimated Value: $332,000 - $348,000
2
Beds
3
Baths
1,230
Sq Ft
$276/Sq Ft
Est. Value
About This Home
This home is located at 9441 Havasu Canyon Ave, Las Vegas, NV 89166 and is currently estimated at $339,328, approximately $275 per square foot. 9441 Havasu Canyon Ave is a home located in Clark County with nearby schools including James Bilbray Elementary School, William & Mary Scherkenbach Elementary School, and Edmundo "Eddie" Escobedo, Sr. Middle School.
Ownership History
Date
Name
Owned For
Owner Type
Purchase Details
Closed on
Jul 21, 2009
Sold by
Fannie Mae
Bought by
Light Jared M and Light Jennie M
Current Estimated Value
Home Financials for this Owner
Home Financials are based on the most recent Mortgage that was taken out on this home.
Original Mortgage
$78,551
Outstanding Balance
$51,992
Interest Rate
5.59%
Mortgage Type
FHA
Estimated Equity
$287,336
Purchase Details
Closed on
Feb 10, 2009
Sold by
Palaganas Francisco Y and Palaganas Zenaida F
Bought by
Federal National Mortgage Association
Purchase Details
Closed on
Dec 14, 2004
Sold by
Richmond American Homes Of Nevada Inc
Bought by
Palaganas Francisco Y and Palaganas Zenaida F
Home Financials for this Owner
Home Financials are based on the most recent Mortgage that was taken out on this home.
Original Mortgage
$200,000
Interest Rate
6%
Mortgage Type
New Conventional
Create a Home Valuation Report for This Property
The Home Valuation Report is an in-depth analysis detailing your home's value as well as a comparison with similar homes in the area
Home Values in the Area
Average Home Value in this Area
Purchase History
| Date | Buyer | Sale Price | Title Company |
|---|---|---|---|
| Light Jared M | $80,000 | Lawyers Title Of Nevada Hend | |
| Federal National Mortgage Association | $215,843 | Fidelity National Default So | |
| Palaganas Francisco Y | $250,000 | Stewart Title Of Nevada |
Source: Public Records
Mortgage History
| Date | Status | Borrower | Loan Amount |
|---|---|---|---|
| Open | Light Jared M | $78,551 | |
| Previous Owner | Palaganas Francisco Y | $200,000 |
Source: Public Records
Tax History Compared to Growth
Tax History
| Year | Tax Paid | Tax Assessment Tax Assessment Total Assessment is a certain percentage of the fair market value that is determined by local assessors to be the total taxable value of land and additions on the property. | Land | Improvement |
|---|---|---|---|---|
| 2025 | $1,530 | $82,131 | $28,350 | $53,781 |
| 2024 | $1,417 | $82,131 | $28,350 | $53,781 |
| 2023 | $944 | $79,591 | $29,050 | $50,541 |
| 2022 | $1,313 | $69,254 | $23,100 | $46,154 |
| 2021 | $1,216 | $65,570 | $21,700 | $43,870 |
| 2020 | $1,126 | $63,392 | $19,950 | $43,442 |
| 2019 | $1,055 | $59,811 | $17,150 | $42,661 |
| 2018 | $1,007 | $55,526 | $14,700 | $40,826 |
| 2017 | $1,660 | $50,650 | $12,250 | $38,400 |
| 2016 | $944 | $43,110 | $9,800 | $33,310 |
| 2015 | $941 | $38,426 | $8,050 | $30,376 |
| 2014 | $911 | $26,974 | $5,250 | $21,724 |
Source: Public Records
Map
Nearby Homes
- 9527 Havasu Canyon Ave
- 8250 N Grand Canyon Dr Unit 2110
- 8250 N Grand Canyon Dr Unit 1166
- 8250 N Grand Canyon Dr Unit 1159
- 8250 N Grand Canyon Dr Unit 2001
- 9655 Skye Star Ave
- 9328 Daffodil Sun Ave
- 8384 Vanhoy Creek St
- 8352 Vanhoy Creek St
- 8385 Vanhoy Creek St
- 8337 Vanhoy Creek St
- 8321 Vanhoy Creek St
- 9690 Hiking Ave
- 9685 Bold Skye Ave
- 8305 Vanhoy Creek St
- 9710 Hiking Ave
- 8330 Carabiner Ct
- 9643 Wildflower Vista Ave
- 9333 Pearblossom Sky Ave
- 8216 Brilliant Pompon Place
- 9445 Havasu Canyon Ave
- 9437 Havasu Canyon Ave
- 9433 Havasu Canyon Ave
- 9449 Havasu Canyon Ave
- 9442 Havasu Canyon Ave
- 9438 Havasu Canyon Ave
- 9438 Havasu Canyon Ave
- 9438 Havasu Canyon Ave
- 9429 Havasu Canyon Ave
- 9453 Havasu Canyon Ave
- 9446 Havasu Canyon Ave
- 9434 Havasu Canyon Ave
- 9450 Havasu Canyon Ave
- 9450 Havasu Canyon Ave Unit 1
- 9425 Havasu Canyon Ave
- 9425 Havasu Canyon Ave Unit na
- 9457 Havasu Canyon Ave
- 9430 Havasu Canyon Ave
- 9441 Grandview Spring Ave
- 9437 Grandview Spring Ave